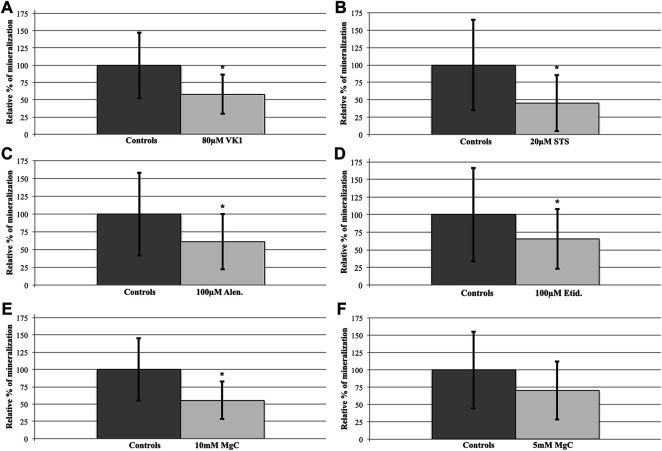
IMAGE

FIGURE 2

ID
ZDB-IMAGE-220325-13
Source
Figures for Van Gils et al., 2022
Image
Figure Caption

FIGURE 2

Compound treatment effects on the abcc6acmg52/cmg52 spinal hypermineralization phenotype. After semiquantification and statistical analysis, mean ± SD percentile values of the spinal mineralization were normalized per compound to the respective control values of the untreated abcc6acmg52/cmg52 fish. (A) 80 µM VK1 (58 ± 28) versus C (100 ± 48), 42% reduction (B) 20 µM STS (45 ± 40) versus C (100 ± 65), 55% reduction (C) 100 µM Etid. (65 ± 43) versus C (100 ± 67), 35% reduction (D) 100 µM Alen. (61 ± 39) versus C (100 ± 58), 39% reduction (E) 10 mM MgC (55 ± 27) versus C (100 ± 55), 45% reduction (F) 5 mM MgC (70 ± 42) versus C (100 ± 55), 30% reduction. Treatments resulted in significant reductions (*p < 0.05), except for 5 mM MgC.

Acknowledgments
This image is the copyrighted work of the attributed author or publisher, and ZFIN has permission only to display this image to its users. Additional permissions should be obtained from the applicable author or publisher of the image. Full text @ Front Pharmacol