
|
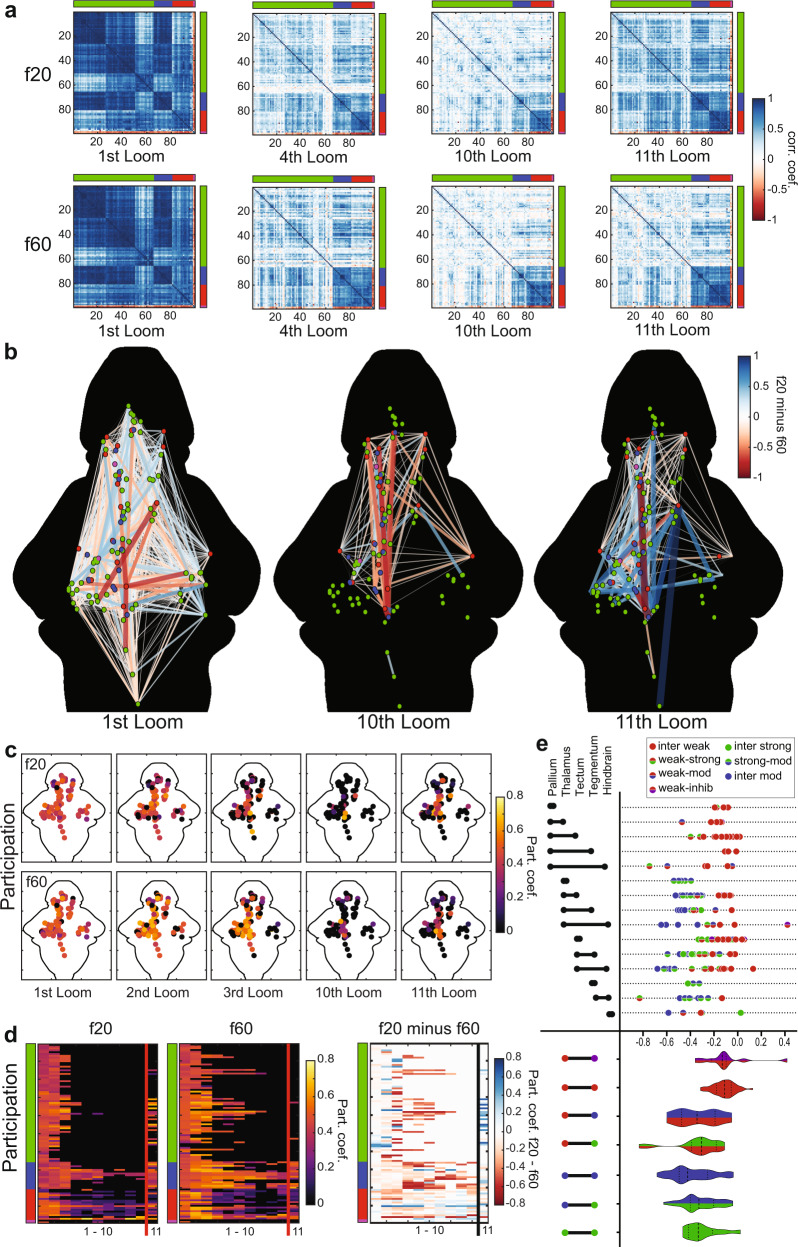
Fig. 4
a Correlation matrices for activity of 99 nodes representing ROIs across the whole brain. The functional clusters to which each node belongs are indicated on the axes, using the color code from Fig. 2. Darker blue shades represent stronger positive correlations for any given node pair, and red indicates negative correlations (see color scale, a). b A graphic representation of correlations across the 99 nodes, whose functional clusters are indicated by their colors and anatomical positions represented spatially. The colors and width of the lines indicate the relative correlation across the f20 and f60 experiments (f20 correlation minus f60 correlation), where red indicates stronger correlations in f60 and blue indicates stronger correlations in f20 (see color scale). Only edges with correlations above 0.75 in either the f20 or the f60 matrices are displayed. c A heat map of the participation coefficient for each of the 99 nodes during the 1st, 2nd, 3rd, 10th, and 11th loom stimuli of the f20 and f60 experiments. d Raster plots showing the participation coefficient of each node across the first 11 stimuli for f20 and f60, and the relative participation (f20 value minus f60 value) where blue indicates stronger f20 participation and red indicates stronger f60 participation. The functional clusters for each node are indicated, using the color code from Fig. 2. e Changes in correlation strength for edges from the 10th to the 11th looms of f20, indicating the impact of the recovery from habituation. Values shown are calculated for each edge as its strength in the 10th loom minus its strength in the 11th loom, with more negative values indicating edges that showed more pronounced recovery between the 10th and 11th looms (top). The functional clusters for each edge’s two nodes are color-coded and the brain regions that the edges span are indicated on the left. Violin plots (bottom) show the cumulative distributions of edges connecting different types of functional clusters (left). Dashed lines indicate the median and dotted lines indicate the first and third quartiles.