IMAGE

Figure 3

ID
ZDB-IMAGE-220303-13
Source
Figures for Benardais et al., 2022
Image
Figure Caption

Figure 3

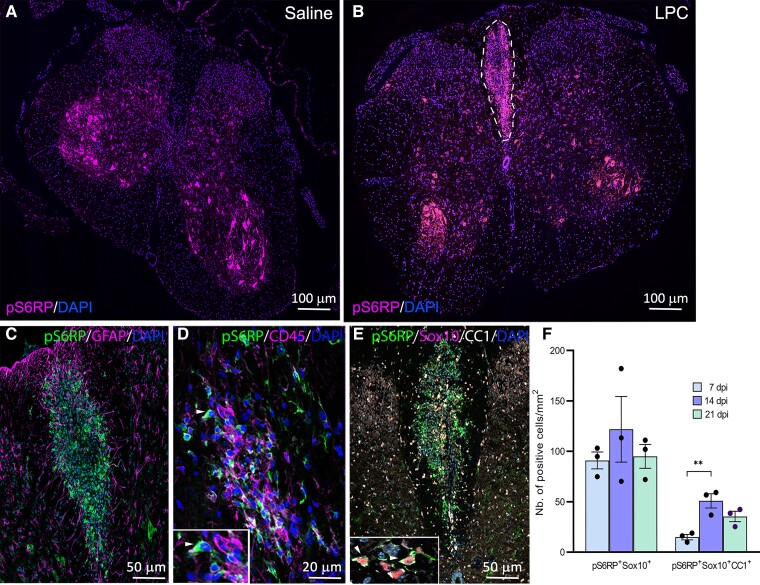
Expression of pS6RP in LPC-induced demyelinated lesions. (A) Expression of pS6RP in the saline-injected spinal cord. (B) pS6RP immunolabeling in LPC-induced demyelinated spinal cord at 7 dpi. pS6RP is upregulated in the LPC lesion of the dorsal funiculus (dashed lines). (C) Co-immunolabelling of pS6RP and GFAP. Note that GFAP+ astrocytes are not stained with the anti-pS6RP antibody. (D) Co-immunolabelling of pS6RP and CD45 reveals expression in few monocytes/macrophages (arrowhead, inset). (E) Triple immunostaining for pS6RP, Sox10 and CC1. Inset (E) illustrates the expression of pS6RP in Sox10+CC1+ oligodendrocytes in the lesion at 7 dpi (arrowheads). (F) Quantification of pS6RP-expressing oligodendrocytes showed a peak of pS6RP expression at 14 dpi, coinciding with the remyelination phase of the lesion. Data represent mean ± SEM; N = 3 independent experiments at each timepoint. ANOVA followed with post hoc Tukey's pairwise multiple comparison tests: **P ≤ 0.01. Scale bars: (A and B), 100 µm; (C and E), 50 µm; (D), 20 µm.

Acknowledgments
This image is the copyrighted work of the attributed author or publisher, and ZFIN has permission only to display this image to its users. Additional permissions should be obtained from the applicable author or publisher of the image. Full text @ Brain Commun