
Image
|
Figure Caption
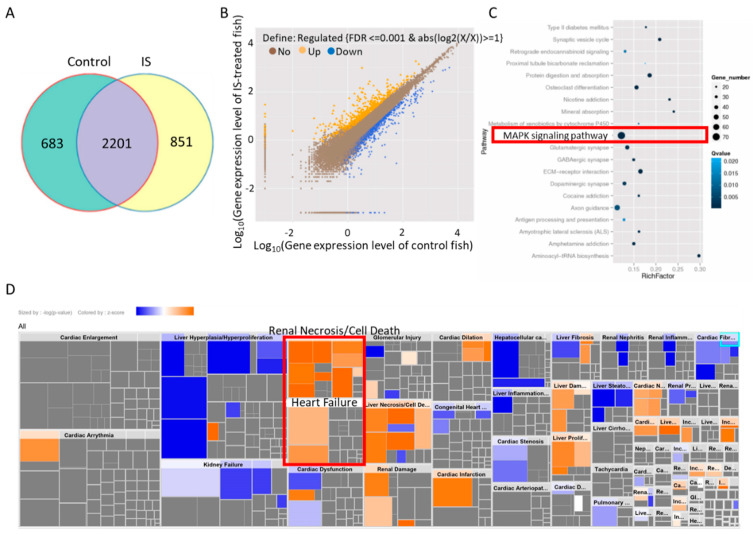
Figure 4
KEGG enrichment and IPA of differentially expressed genes in zebrafish. (A) The Venn diagram shows the coexpressed genes between IS-treated and control embryos. (B) Scatter plots of all expressed genes between IS-treated and control zebrafish embryos plotted as log10 (gene expression level with FDR ≤ 0.001 & abs(log2(X/X)) ≥ 1). (C) Scatter plot of KEGG enrichment analysis of the differentially expressed genes between IS-treated and control fish embryos. The red border indicates the candidate MAPK pathway. (D) Toxicological functions of the differentially expressed genes related to IS exposure.
Acknowledgments
This image is the copyrighted work of the attributed author or publisher, and
ZFIN has permission only to display this image to its users.
Additional permissions should be obtained from the applicable author or publisher of the image.
Full text @ Antioxidants (Basel)