
|
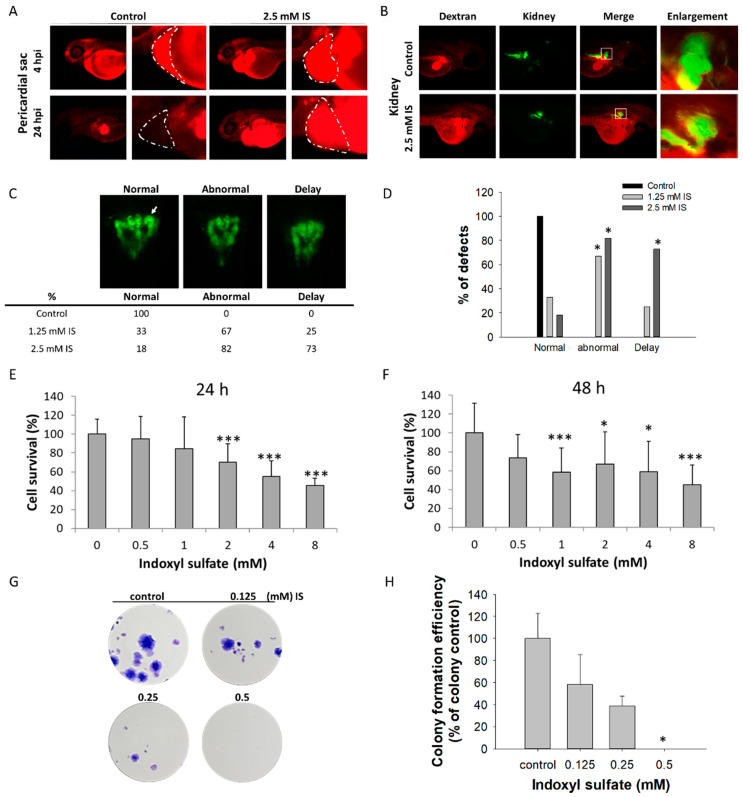
Figure 3
Impact of IS on renal development. The results of the zebrafish assay are shown in (A–D); those obtained with the HEK293T cell line are shown in (E–H). After treatment with IS, dextran clearance was reduced, and tubular transport function was disrupted. IS- and vehicle-treated larval zebrafish were injected with 10 kDa rhodamine-labeled dextran at 48 hpf, and the fluorescence of each embryo was measured after 4 and 24 h, respectively. (A) Visual comparison of rhodamine-labeled dextran clearance in two individual fish after IS treatment. The impact of IS exposure on renal clearance of dextran was assessed to determine renal function. (B) Morphological changes in renal development. ■ Red fluorescence indicates rhodamine-labeled dextran; ■ green fluorescence indicates kidney tissue. (C) Results of renal defect assessment. The white arrows indicate perinephric tubules. (D) Quantitative results of (C) Fisher’s exact test. An MTS-based assay was used to assess the viability of human HEK293T cells treated with IS for (E) 24 h and (F) 48 h. The results of the colony formation assay are shown in (G) HEK293T cells were treated with the indicated concentrations of IS (from 0.125 to 0.5 μM) for 14 days. Afterward, the cells were fixed in 4% paraformaldehyde and stained with Giemsa. (H) Quantitative analysis of (G) the colony formation assay. * p < 0.05, *** p < 0.005.