
IMAGE
Figure 3
- ID
- ZDB-IMAGE-220224-3
- Publication
- Wang et al., 2022 - A novel deep learning-based 3D cell segmentation framework for future image-based disease detection
- All Figures
- Figures for Wang et al., 2022
Image
|
Figure Caption
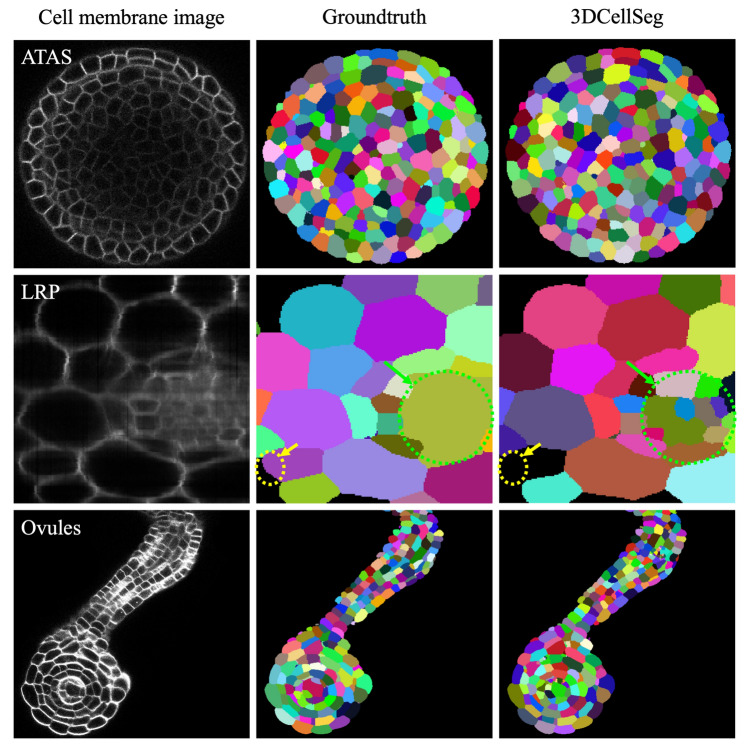
Figure 3
3DCellSeg performance on the ATAS, LRP, and Ovules datasets. [Note: Different cell instances were randomly assigned different colors. The LRP dataset images are annotated: the yellow circle shows where 3DCellSeg has made a mistake and the green circle shows that 3DCellSeg can segment cells that were not labelled in the ground truth. The cellular images were generated by Python Matplotlib (
Acknowledgments
This image is the copyrighted work of the attributed author or publisher, and
ZFIN has permission only to display this image to its users.
Additional permissions should be obtained from the applicable author or publisher of the image.
Full text @ Sci. Rep.