
|
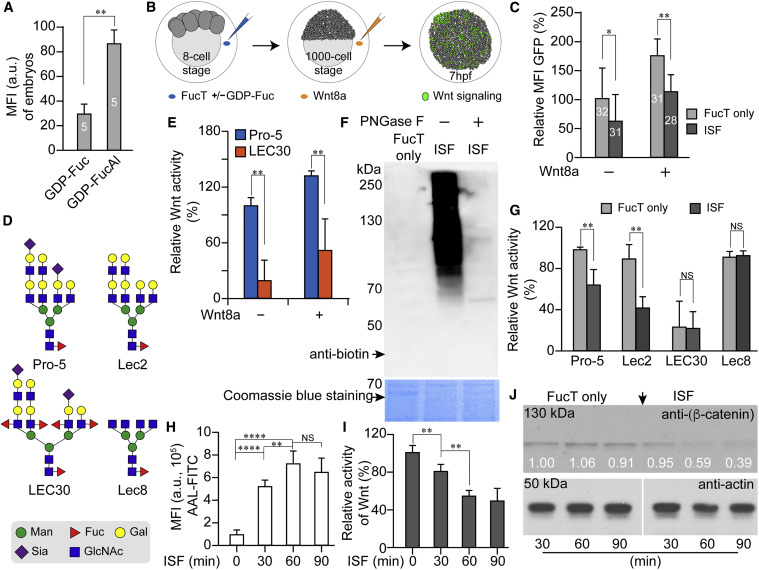
Fig. 1 (A) Relative mean fluorescence intensity (MFI) of traditional bio-orthogonal chemical reporter labeling in the FucT/GDP-Fuc- or FucT/GDP-FucAl-treated embryos was quantified by ImageJ. (B) Flow chart of the impacts of ISF on Wnt-signaling activity in a zebrafish Wnt reporter line. At the 8-cell stage, a FucT/GDP-Fuc pre-mixture, or FucT only, were injected into the chorion to perform ISF or act as control, respectively. To further boost the Wnt-signaling readout, we injected recombinant WNT8a into the chorion at the 1,000-cell stage before the embryos were transferred individually into single wells. Expression of the GFP reporter was quantified at 7 hpf. (C) Comparing the GFP expression level of Wnt reporter embryos treated by ISF or FucT only in the presence or absence of WNT8a. The MFI of GFP was quantified for healthy live embryos at 7 hpf by subtracting background in samples with no GFP expression, and the GFP-MFI of embryos treated with FucT only was set as 100%. The numbers on the bar graph represent the numbers of healthy embryos used in this assay. (D) Typical complex N-glycans present on the cell surface glycoproteins of CHO Pro-5 cells, and glycosylation mutants Lec2, LEC30, and Lec8 cells (North et al., 2010). Pro-5 and Lec2 cells carry LacNAc with no Fuc attached and are excellent substrates for ISF. Lec8 has no LacNAc, and LEC30 has many fucosylated LacNAcs. Sugar symbols are from the Symbol Nomenclature for Glycans (Neelamegham et al., 2019). (E) Comparison of Wnt activity in Pro-5 and LEC30 cells in the presence or absence of WNT8a. (F) Western blot assay for detection of biotinylated glycoproteins in Pro-5 cells that generated via GDP-Fuc-biotin-ISF before or after PNGase F-treatment. Equal loading determined by Coomassie blue staining (lower panel). (G) Comparison of Wnt activity in CHO parent and three mutant lines treated with ISF or FucT only. (H) Quantitative flow-cytometry analysis of time-dependent incorporation of α(1–3)-Fuc onto Pro-5 cell-surface glycans via ISF treatment. (I) Time-dependent decrease of Wnt activity in Pro-5 cells treated by ISF. (J) Time-dependent decrease of the β-catenin level in ISF-treated Pro-5 cells. Western blot of anti-β-catenin (upper panel) and actin (lower panel). The numbers indicate the relative quantification of anti-β-catenin level to actin by ImageJ. The 30-min, non-treated sample was set as 100%. Number (in white) indicates the relative β-catenin level normalized to the corresponding level of actin. In (A) and (B), results are from the same set of samples and the signal intensity of sample at 0-min treatment is set as 100%. Error bars represent the SD of three biological replicates. Unpaired two-tailed Student's t test: ∗p < 0.05, ∗∗p < 0.01, ∗∗∗p < 0.001; NS, not significant.