
|
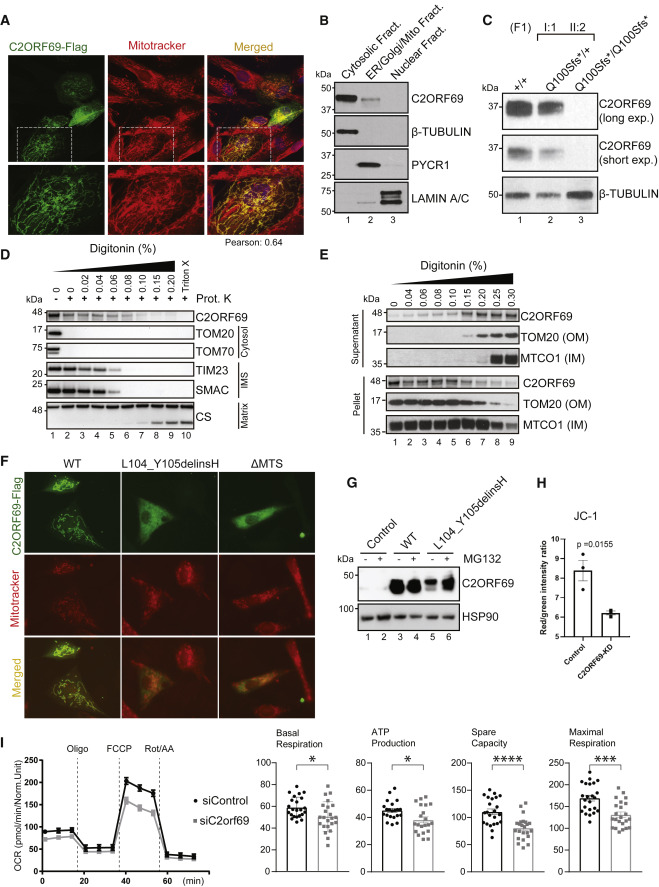
Fig. 3 (A) Immunostaining of BJ-TERT fibroblasts overexpressed with C2ORF69-FLAG with FLAG antibodies (green) revealed co-localization with mitochondria marker, MitoTracker CXMRos (red). Pearson’s correlation coefficient was analyzed with Fiji software. (B) Cellular fractionation of primary fibroblasts indicates that endogenous C2ORF69 is mostly cytoplasmic, but a small fraction is associated with membranous fractions including mitochondria. (C) C2ORF69 protein is absent in primary dermal fibroblast with the homozygous p.Gln100Serfs∗18 variant. (D) Proteinase K protection assay of HEK293T mitochondria to reveal topology and submitochondrial location of endogenous C2ORF69. The majority of the protein resides in the outer membrane vulnerable to proteinase K, and a small fraction displays evidence of translocation into the mitochondria. IMS, intermembrane space. (E) Differential membrane extraction assays in HEK293T mitochondria confirm that endogenous C2ORF69 is both cytosolic and mitochondrial membrane associated. (F) Immunostaining of BJ-TERT fibroblasts overexpressed FLAG epitope-tagged wild-type (WT) C2ORF69, L104_Y105delinsH, and C2ORF69 without mitochondria-targeting signal (ΔMTS). We immunostained cells with FLAG antibodies (green) and MitoTracker CXMRos (red) to determine co-localization. (G) Immunoblot of fibroblasts overexpressing wild-type C2ORF69 or L104_Y105delinsH treated with proteasome inhibitor, MG132 (20 μM). Treatment with MG132 rescued expression level of p.Leu104_Tyr105delinsHis to near WT levels. (H) Ratiometric JC-1 (1 μM) membrane potential measurement in ReN VM neurons. Each dot represents the average of all ratiometric measurements across three separate 40× fields of one well. Data are mean ± SEM, and p value is derived from unpaired t test. (I) Agilent Seahorse Mito Stress Test on siControl- and siC2orf69-differentiated ReNcell VM neurons with basal respiration, ATP production, maximal respiration rate, and spare values indicated.