
|
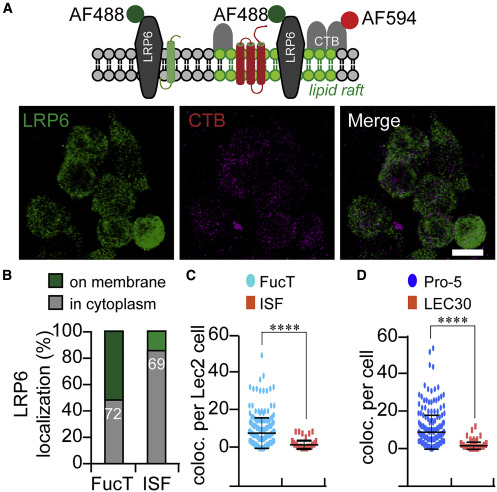
Fig. 3 (A) Schematic representation (top panel) of the membrane topological location of the lipid-raft markers CTB and LRP6. The co-localization of LRP6 and CTB (gray dots) in lipid rafts was calculated from confocal images using ImageJ, based on immunofluorescence of antibody to LRP6 (green) and labeled CTB (red). Scale bar, 20 μm. (B) Comparing the co-localization of LRP6 and CTB showed that LRP6 moved from membrane to cytoplasm in ISF-treated Pro-5 cells. The numbers show the cells counted in this assay. (C and D) Plots of the co-localization of LRP6 and CTB (per cell) in ISF-treated and FucT-treated Lec2 cells (C) or in untreated LEC30 cells (D). Unpaired two-tailed Student's t test: ∗∗∗∗p < 0.001.