
Image
|
Figure Caption
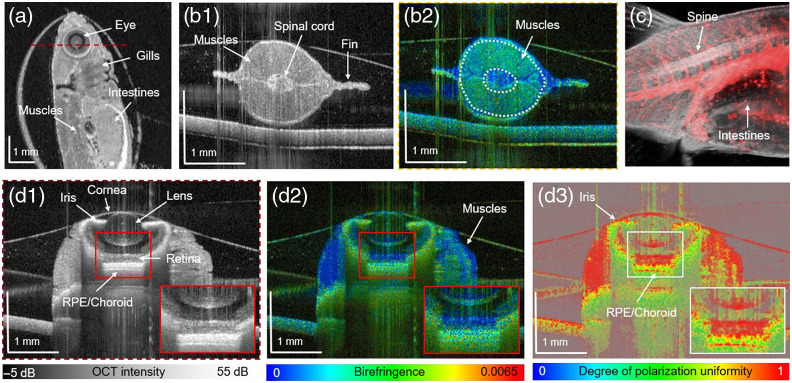
Fig. 2
Imaging of 1-month-old zebrafish: (a) En face scattering-based image; (b1) transversal B-scan; (b2) birefringence tomogram; (c) composition image of the OCT scatter-intensity (gray) and angiography (red) data; (d1) transversal tomogram at the indicated position by red dashed lines in (a) with a zoom-in; (d2) birefringent-based B-scan; and (d3) DOPU tomogram (RPE, retinal pigment epithelium).
Acknowledgments
This image is the copyrighted work of the attributed author or publisher, and
ZFIN has permission only to display this image to its users.
Additional permissions should be obtained from the applicable author or publisher of the image.
Full text @ J. Biomed. Opt.