
|
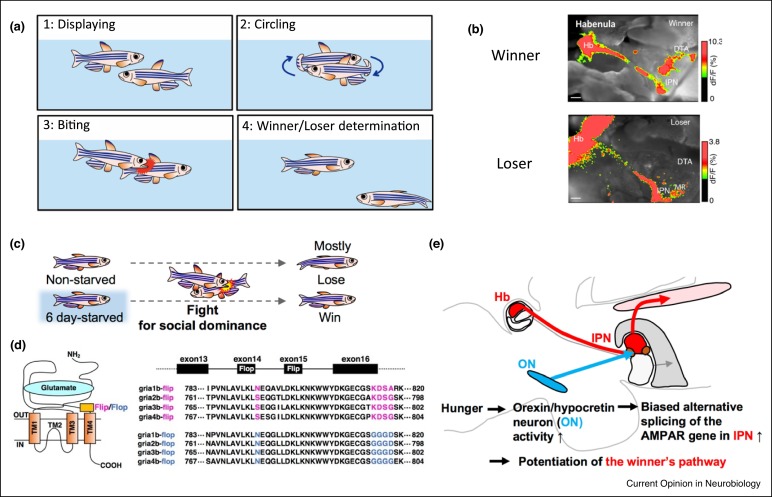
Fig. 2 (a) Schematic illustration of dyadic fighting behaviors in male zebrafish. (b) Visualization of excitation propagation pathway (labeled red) from the Hb after electrical stimulation of the Hb by calcium imaging of the Oregon green 488 BAPTA-1AM-impregnated acute brain slices from a winner (upper panel), and a loser (lower panel) fish. (c) Six day-starved zebrafish mostly win the fight for social dominance against non-starved fish. (d) (left panel) Schematic illustration of AMPAR subunit. Flip/flop site is shown. TM, transmembrane domain. (right panel) Amino acid sequence encoded in exon 14 (flop) or exon 15 (flip) of gria1b-4b gene are shown. The distinctive amino acid residues for flip/flop are indicated by pink or blue color. (e) Schematic illustration showing how the IPN input from the hypothalamic orexin/hypocretin neurons potentiates the winner’s pathway.