
|
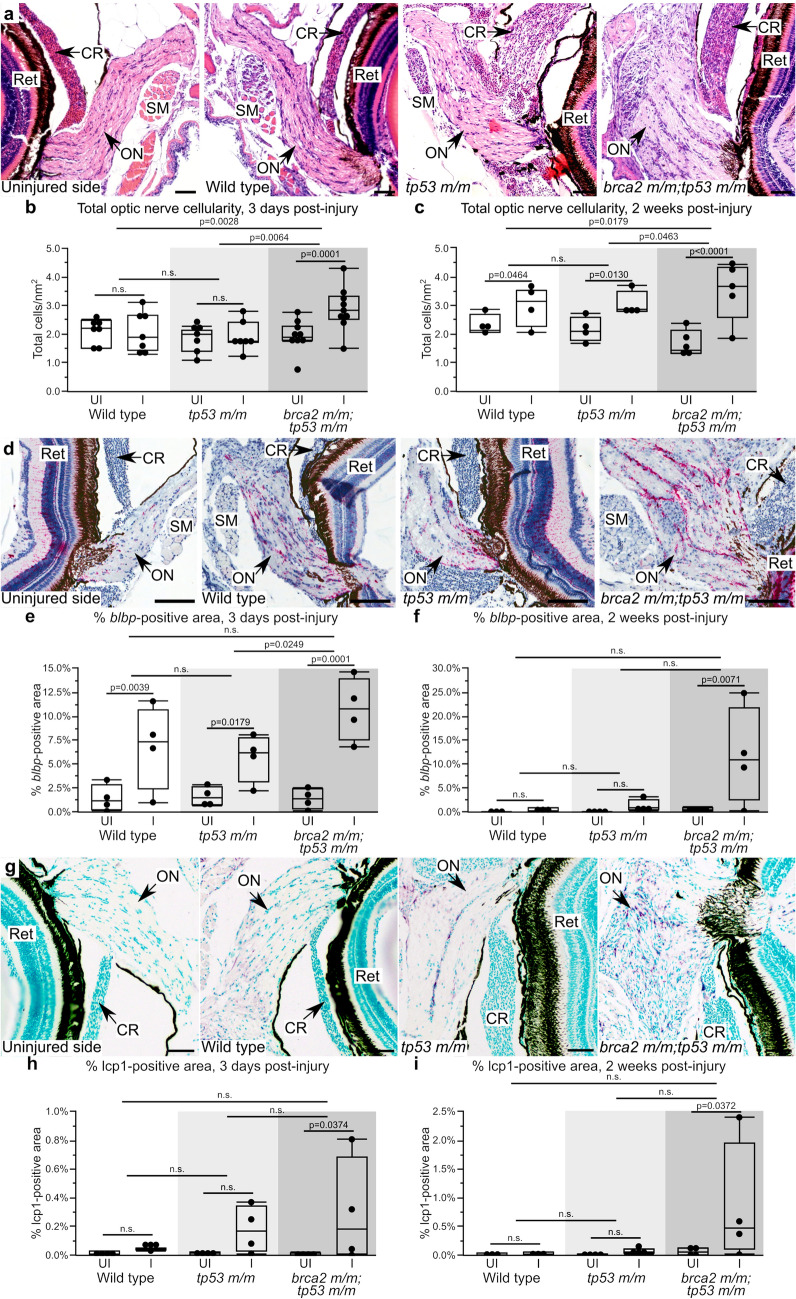
Figure 3
brca2 m/m;tp53 m/m zebrafish exhibit increased proliferative responses in the injured optic nerve. (a) Representative histologic section of the optic nerve pathway after unilateral optic nerve injury. (b,c) Quantitative analysis of the total cellularity in the uninjured versus injured optic nerve three days (b) and two weeks (c) post-injury. (d) Representative examples of blbp expression (red chromogen), a marker for radial glial cells, in the uninjured and injured optic nerves. (e,f) Quantitative analysis of blbp-positive area in the uninjured versus injured optic nerve three days (e) and two weeks (f) post-injury. (g) Representative examples of lcp1 expression (purple chromogen), a marker for monocytes/macrophages, in the uninjured and injured optic nerves. (h,i) Quantitative analysis of lcp1-positive area in the uninjured versus injured optic nerve three days (h) and two weeks (i) post-injury. Ret, retina; SM, skeletal muscle; CR, choroid rete; ON, optic nerve; UI, uninjured; I, injured. Scale bar = 50 µm (panels a, g); 100 µm (panel d). All images depict specimens collected at three days post-injury except panel g, in which the brca2 m/m;tp53 m/m specimen shown was collected at two weeks post-injury.