
Image
|
Figure Caption
Figure 2
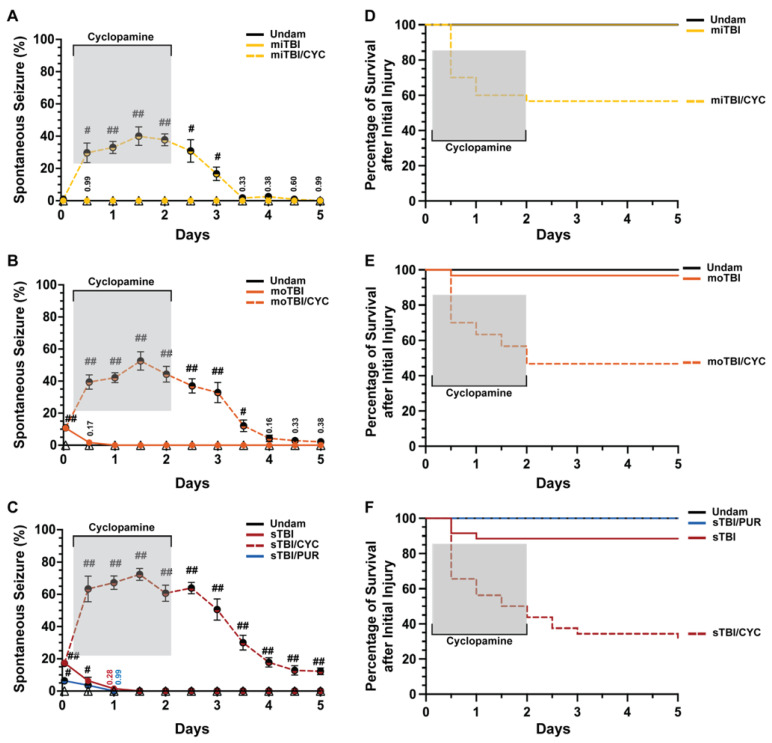
Modulation of Shh alters frequency of TBI-induced PTS events. (A–C) Percentage of fish that displayed spontaneous seizure events spanning the timeframe from within 1 hpi to 5 dpi with and without Shh modulation. (D–F) Percentage of survival across 5 days of fish who initially survived the primary injury across mi-, mo-, and sTBI with and without Shh modulation. Statistical analyses of the repeated-measures data were performed with the Friedman test, n = 100 fish per control/experimental group, grey box denotes period of cyclopamine administration, # p < 0.05, ## p < 0.01.
Acknowledgments
This image is the copyrighted work of the attributed author or publisher, and
ZFIN has permission only to display this image to its users.
Additional permissions should be obtained from the applicable author or publisher of the image.
Full text @ Biomedicines