
|
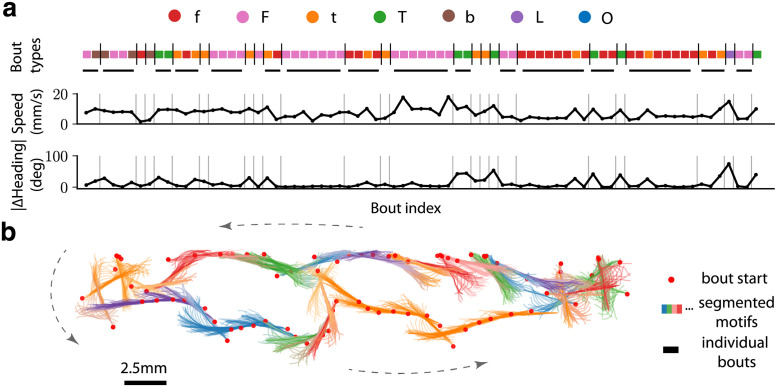
Fig 4 (a) A sample sequence of 75 bouts from the exploratory data segmented (separated by vertical bars) into the most likely sequence of motifs from the learned dictionary. The corresponding speed and absolute change in heading are shown. Motifs longer than one locomotor episode are underlined in gray. (b) A sample trajectory consisting of 80 bouts (head position at the beginning of a bout is shown as a red dot) are segmented into motifs (head and tail at each frame are shown), where successive bouts from the same motif have the same color. The black-colored segments of the trajectory are motifs of length one i.e., single locomotor episodes.