
|
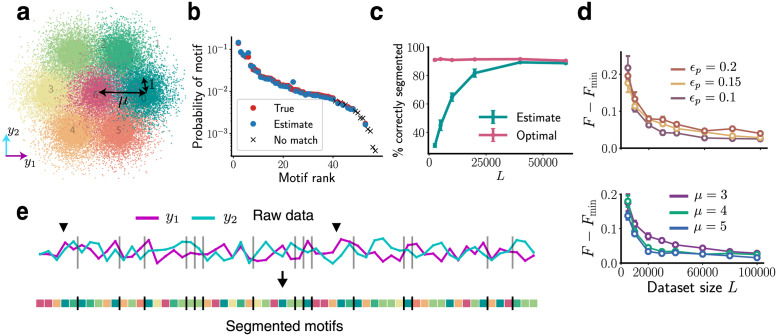
Fig 2 BASS accurately identifies and segments motifs in noisy, synthetic data: (a) The seven clusters from which the two-dimensional data (along y1, y2) is drawn. (b) The true probabilities of the motifs (red dots) and probabilities estimated (blue dots) by our algorithm showing successful reconstruction of the dictionary. The crosses are low-probability motifs not identified by the algorithm (see main text). (c) The percentage of correct segmentations into motifs (cyan) with increasing dataset size. The optimal percentage when the true dictionary is known is shown in pink. In panels b,c and e, we use L = 40000, ϵp = 0, ϵb = 0.5, μ = 3. See S1 Fig for the case ϵp > 0. (d) The difference in the negative log-likelihood per symbol after convergence when the true dictionary is unknown (F) and known (Fmin). Action pattern noise ϵp and locomotor episode noise μ are successfully integrated out with larger datasets. Top: μ = 3, pd = 0.5, Bottom: ϵp = 0.15, pd = 0.5, where pd is the probability of a deletion in a motif instantiation. Error bars are s.e.m. (e) A snippet of the raw data sequence and the most likely partitioning into motifs found by the algorithm. The vertical bars delineate two successive motifs. The black arrows mark two instantiations of the same length-five motif.