
|
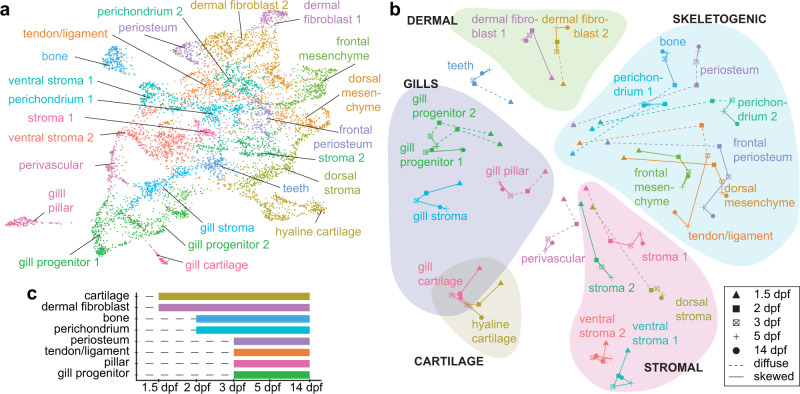
Fig. 4 a UMAP of 14 dpf SnapATAC data shows cell clusters for which top accessible peak modules were calculated for Constellations analysis. b Constellations analysis involves mapping of cluster-specific chromatin accessibility from 14 dpf back to earlier stages and then plotting relatedness of mapped accessibility in two dimensions. Diffuse refers to a stage when cluster-specific chromatin accessibility does not map to a discrete portion of UMAP space, and skewed when it does (see “Methods” for details). Groups of related cell types are color-coded. c Graphical representation from the Constellations analysis of when chromatin accessibility of major cell types first shows a skewed distribution in UMAP space, suggestive of establishment of competency.