
|
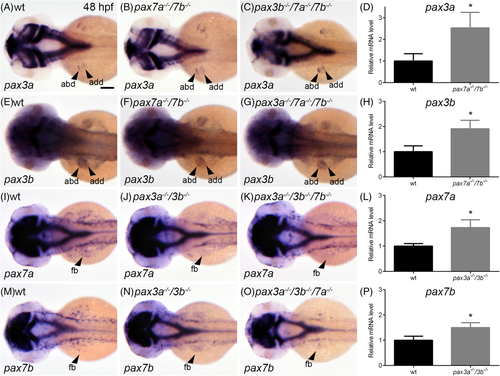
Fig. 7 Expression of pax3 and pax7 is up-regulated in the absence of pax7 and pax3, respectively. Dorsal view showing the expression of pax3a in A wt (n = 18), B, pax7a−/−/7b−/− double mutant (n = 9) and, C pax3b−/−/7a−/−/7b−/− triple mutant embryos (n = 5) at 48 hpf. D, Relative mRNA expression levels of pax3a in wt and pax7a−/−/7b−/− double mutant embryos at 48 hpf. Dorsal view showing the expression of pax3b in E wt (n = 25), F, pax7a−/−/7b−/− double mutant (n = 8), and, G, pax3a−/−/7a−/−/7b−/− triple mutant embryos (n = 5) at 48 hpf. H, Relative mRNA expression level of pax3b in wt and pax7a−/−/7b−/− double mutant embryos at 48 hpf. Dorsal view showing the expression of pax7a in I wt (n = 23), J, pax3a−/−/3b−/− double mutant (n = 11) and, K, pax3a−/−/3b−/−/7b−/− triple mutant embryos (n = 8) at 48 hpf. L, Relative mRNA expression level of pax7a in wt and pax3a−/−/3b−/− double mutant embryos at 48 hpf. Dorsal view showing the expression of pax7b in M wt (n = 42), N, pax3a−/−/3b−/− double mutant (n = 8) and, O, pax3a−/−/3b−/−/7a−/− triple mutant embryos (n = 10) at 48 hpf. P, Relative mRNA expression level of pax7b in wt and pax3a−/−/3b−/− double mutant embryos at 48 hpf. Student's t-test was used to calculate significance (P < .05). Error bars indicate SEM. Arrowheads indicate abductor, adductor of fin bud. Abbreviations: abd, abductor; add, adductor; fb, fin bud. Scale bar: 100 μm