
|
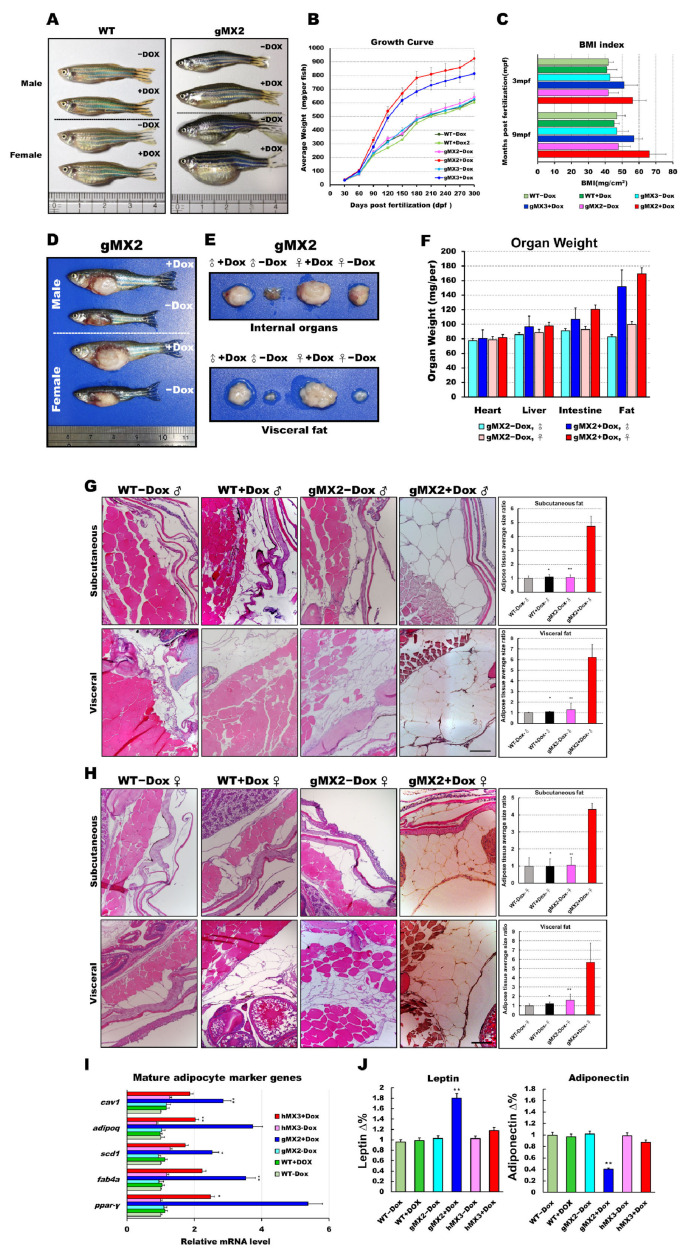
Figure 3 Expression levels of mxd3 regulate somatic growth and obesity in gMX2 adults. (A) Macroscopic view of male and female gMX2 adults compared with WT controls at 10 mpf. (B) Growth curves of zebrafish from juvenile to adult stages in two discrete groups (WT ± Dox, gMX2 ± Dox, and hMX3 ± Dox; n = 24/group). (C) Bar chart displaying the BMI index in two discrete groups (n = 25/group) at 3 and 10 mpf stages. (D) Viscera and visceral fat pads of gMX2 groups at 12 mpf, displaying (E) enlarged internal organs, and (F) fat pad size. (G,H) Histological characteristics of adipose tissue in H&E-stained sections displaying (G) male and (H) female samples. Left: H&E-stained sections displaying adipose tissues of WT ± Dox and gMX2 ± Dox male groups (n = 6/group). Right: morphometric analysis of fat on adipose tissues of average size in each group (n = 6/group). (I) Molecular analysis of visceral adipose tissue of gMX2 and hMX3 groups revealed upregulation of mature adipocyte markers genes, such as ppar-γ, fabp4, scd1, adipoq, and cav1. (J) Blood analysis of leptin and adiponectin. Statistically significant differences from the controls are indicated by * (p < 0.05), and ** (p < 0.01).