IMAGE

FIG 2

ID
ZDB-IMAGE-211209-65
Source
Figures for Singulani et al., 2021
Image
Figure Caption

FIG 2

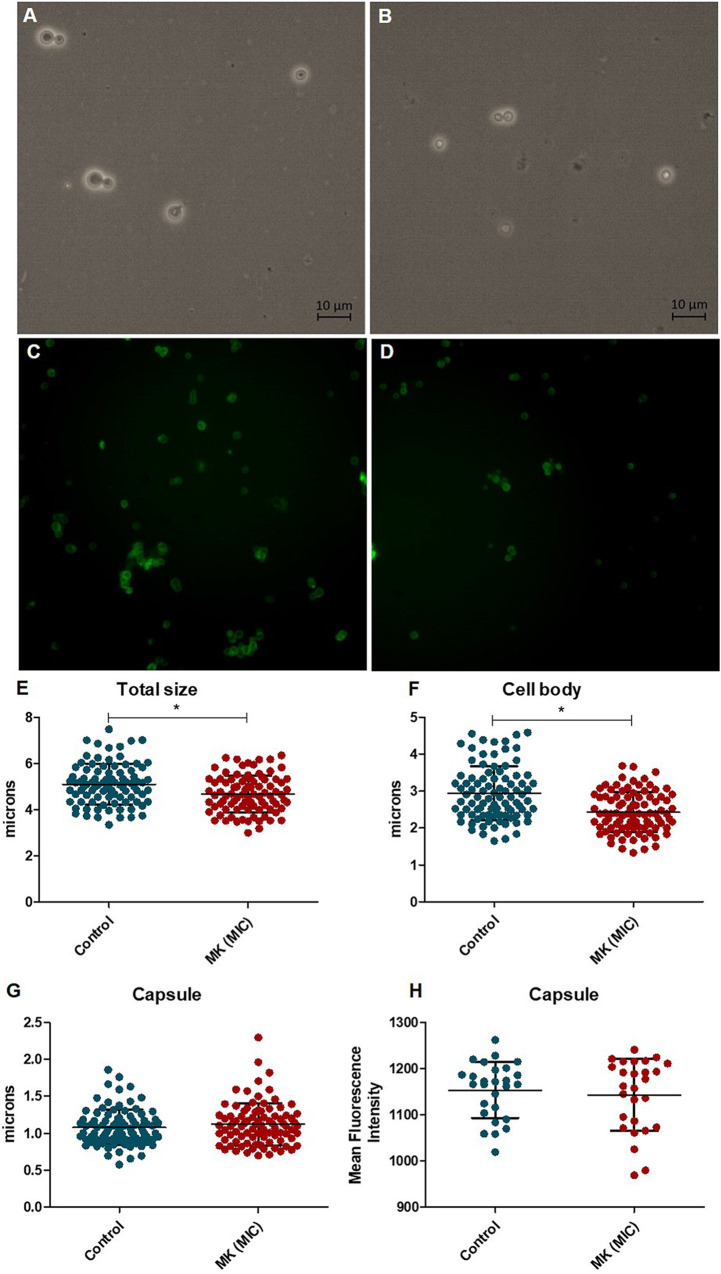
C. neoformans cells exposed to the peptide for 4 h and marked with India ink (A, B, and E to G) or antibody 18b7 (C, D, and H). (A and C) control; (B and D) peptide MK58911-NH2 (MK) at the MIC; (E) total cell diameter; (F) diameter of the cell body (without capsule); (G) diameter of the capsule; (H) average fluorescence intensity per cell. Data represent the means (±SD) from three independent experiments. *, P < 0.05 compared to the control.

Acknowledgments
This image is the copyrighted work of the attributed author or publisher, and ZFIN has permission only to display this image to its users. Additional permissions should be obtained from the applicable author or publisher of the image. Full text @ Antimicrob. Agents Chemother.