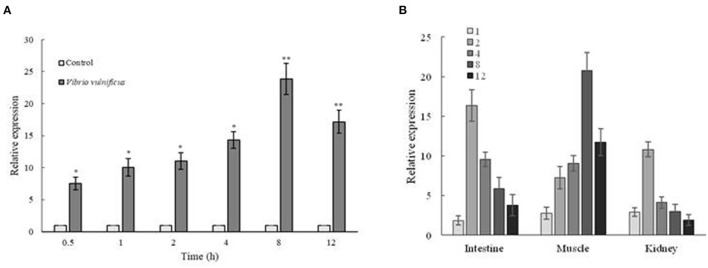
Figure 2
Expression analysis of Zetnf-b in ZF4 cells and zebrafish both infected by Vibrio vulnificus. (A) Expression profile of Zetnf-b using qRT-PCR in ZF4 cells infected with 0.1 MOI V. vulnificus. (B) Tissue expression of Zetnf-b using qRT-PCR in zebrafish infected with V. vulnificus. Total RNA was extracted from the cells, and qRT-PCR was conducted to analyze Zetnf-b and β-actin gene expression at 1 h post-stimulation (1 hpi), 2, 4, 8 and 12 hpi. Data are presented as mean ± standard error (SE) from three independent experiments. * indicates significant difference at P < 0.05. ** indicates significant difference at P < 0.01.

