
|
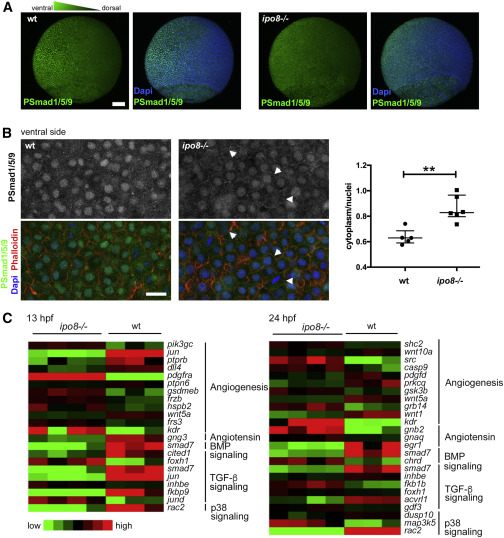
Fig. 5 pSMAD nuclear translocation defects in ipo8−/− embryos highlight impaired TGF-β/BMP signaling (A) Maximal projections of confocal Z stacks of WT and ipo8−/− embryos labeled for pSmad1/5/9 (green) and DAPI (blue) showing well-defined ventral to dorsal gradient of pSmad5 in WT gastrulating zebrafish embryos (left panel) but not in the ipo8−/− embryos (right panel). Scale bar represents 100 μm. (B) Confocal images of the ventral sides of WT and ipo8−/− embryos labeled for pSmad1/5/9 (green), phalloidin (red), and DAPI (blue). Arrowheads highlight the membrane localization of the pSmad staining in the ipo8−/− mutants. Scale bar represents 20 μm. Dot plots representative of three experiments show quantifications of the ratio of pSmad1/5/9 cytoplasmic signal over nuclear signal; 5 WT and 6 ipo8−/− embryos were analyzed. Median and IQR are shown. p values were calculated by Mann Whitney test (∗∗p < 0.01). (C) Heatmaps of differentially expressed genes between WT and ipo8−/− embryos at 13 and 24 hpf. Three to four biological replicates are shown per group. The top enriched gene ontology term for biological process is highlighted for each cluster.