
|
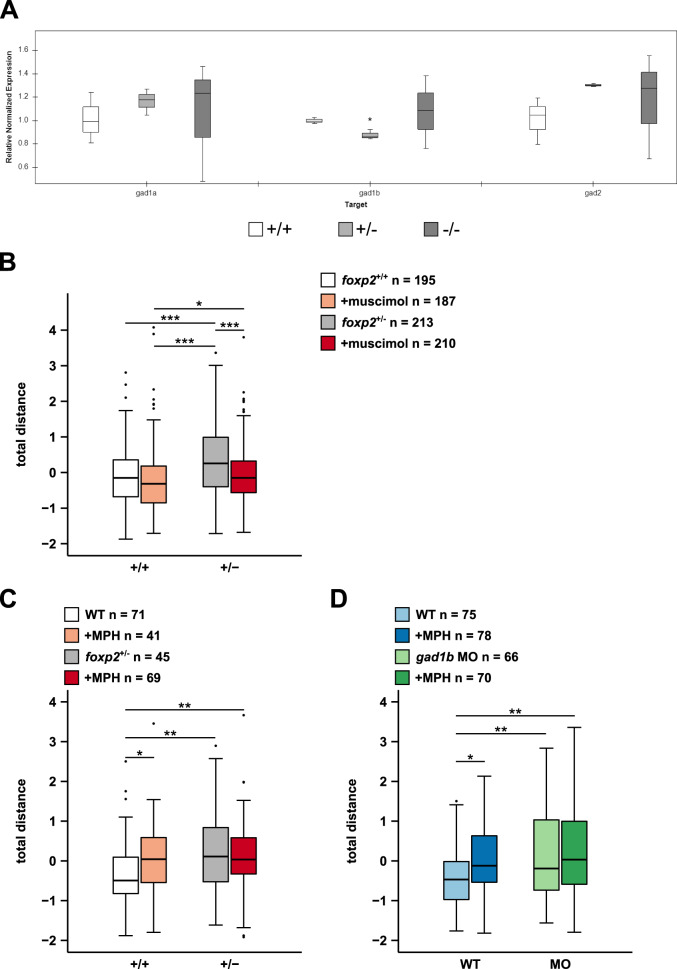
Fig. 5
A Transcript levels of gad1a, gad1b and gad2 in foxp2+/+ (white), foxp2+/− (light grey) and foxp2−/− (dark grey) siblings assessed by qPCR. *P < 0.05. B Locomotor activity, displayed as total distance swum, of 5 dpf old foxp2+/+ and foxp2+/− following a bath-application in 0.05 mM GABA-A-R agonist muscimol (light red and dark red, respectively) or Danieau’s solution (white and grey, respectively). C Locomotor activity, displayed as total distance swum, of 5 dpf old foxp2+/+ and foxp2+/− after exposure to Danieau’s solution (white and grey, respectively) or 0.012 mM methylphenidate (MPH, light red and dark red, respectively). D Locomotor activity, displayed as total distance swum, of 5 dpf old gad1b morphants (MO) and wildtype controls (WT) exposed to Danieau’s solution (light green and light blue, respectively) or 0.012 mM MPH (dark green and dark blue, respectively). Raw data was standardised using z-score transformation. *P < 0.05, **P < 0.01, ***P < 0.001.