
FIGURE 2
|
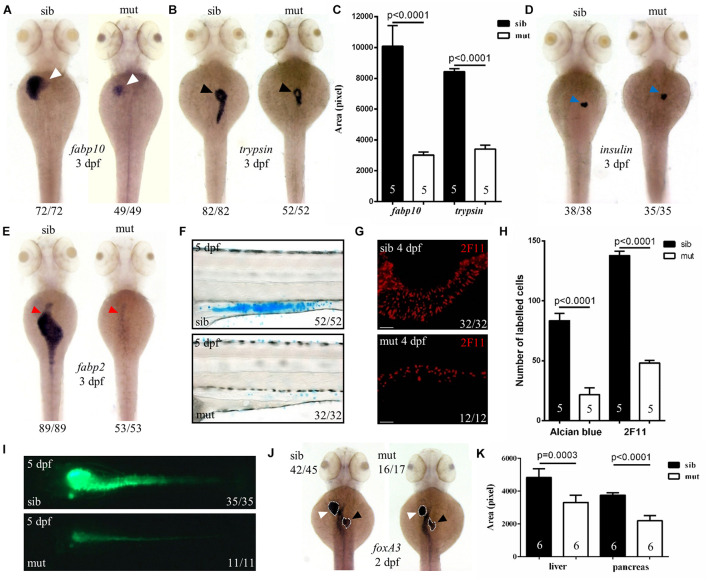
FIGURE 2
Figure 2. Defects in the development of digestive organs in ltv1Δ14/Δ14 mutant. (A,B,D,E) WISH using the hepatocyte marker fabp10, acinar cell marker trypsin, beta cell marker insulin, and enterocyte marker fabp2 at 3 dpf. (C) Quantification of fabp10 (siblings, N = 5; mutants, N = 5) or trypsin (siblings, N = 5; mutants, N = 5) positive area in panel (A) or (B), respectively. Bars represent means with SD. (F) Alcian blue-stained goblet cells at 5 dpf. (G) Enteroendocrine cells (2F11+) in the intestine bulb at 4 dpf. (H) Quantification of Alcian blue-stained (siblings, N = 5; mutants, N = 5) or 2F11-positive (siblings, N = 5; mutants, N = 5) cells in panel (F) or (G), respectively. Bars represent means with SD. (I) Gut lumen labeled by DCFH-DA at 5 dpf. (J) WISH using the pan-endodermal marker foxA3 at 2 dpf. (K) Quantification of the liver and pancreas area labeled by foxA3 (siblings, N = 6; mutants, N = 6) in panel (J). Bars represent means with SD. White arrowhead: liver; black arrowhead: exocrine pancreas; blue arrowhead: endocrine pancreas; red arrowhead: intestine.