
|
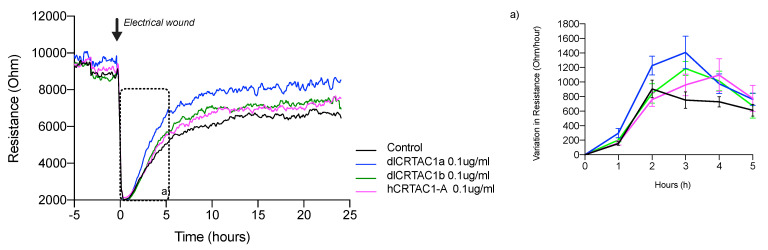
Figure 2 Electrical resistance of the confluent SJD.1 cell monolayer after scratching with an electrical discharge. A representative trace of the recovery of cell resistance after an electrical wound/ scratch (indicated by the arrow) is presented at 4 kHz. Changes in resistance are presented in different colors for each group of treated cells: control cells (black); hCRTAC1-A (pink), dlCrtac1a (blue) and dlCrtac1b (green). For each experimental group, the variation in resistance during the exponential phase of cell recovery (between 0 h–5 h after the wound/scratch) was estimated and is presented in insert (a). Data are presented as the average resistance of at least three independent experiments performed with two / three replicates for each experimental group.