
|
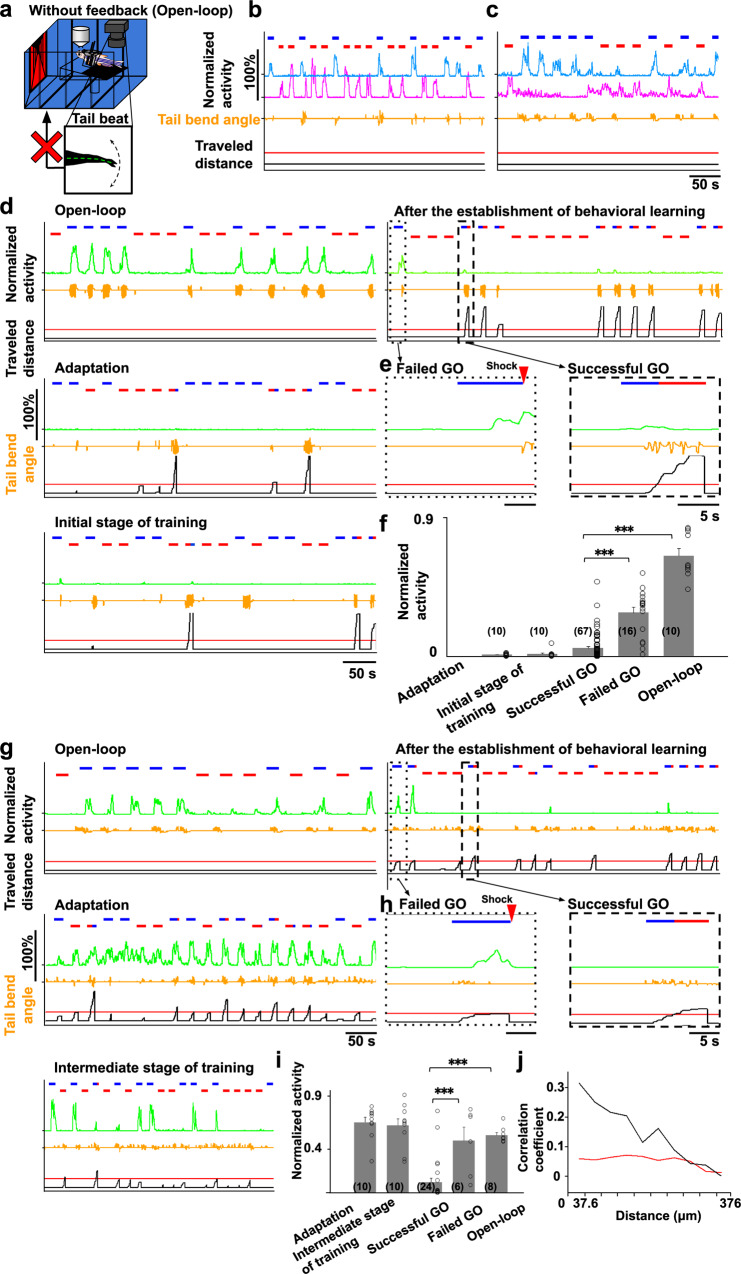
Fig. 6 Notations in the figures are identical to Fig 3b. a The open-loop experiment in which feedback was turned off. The scenery did not move in response to the tail beat. b, c The activity of the two ensembles encoding the color rules that blue is dangerous (cyan line) and that red is safe (magenta line) in the open-loop condition. b Data from the fish used in Fig.4a–d. c Data from the fish used in Fig.4e–h. d The activity of an ensemble in the open-loop condition (upper left panel), after behavioral learning was established (upper right panel), in the adaptation (middle left panel), and in the initial stage of training (bottom left panel). The activity of the ensemble increased in the GO trial in the open-loop condition and the failed GO trial but not in the successful GO trials in the closed-loop condition. e Left: enlarged view of a failed GO trial (boxed area of the dotted line in (d) upper right panel). Right: enlarged view of a successful GO trial (boxed area of the dashed line in (d) upper right panel). Red rectangle indicates the timing of shock. f Comparison of peak activity of the ensemble when fish perceived the starting color in the adaptation stage, initial stage of training, successful GO trials, failed GO trials, and open-loop GO trials. Columns and error bars: mean ± SEM. Each circle indicates the value in each GO trial. The numbers in parentheses are the number of trials used in the statistics. Successful GO vs failed GO, ***P = 7.79 × 10⁻¹³; successful GO vs open-loop, ***P = 2.54 × 10⁻³⁴, F(4, 110) = 101.97. One-way ANOVA, Bonferroni’s multiple comparison test. g–i Results of the same analysis as (d–f) above for another fish. The timing of the increased activity along with behavioral learning was different from the data shown in (d–f). i The numbers in parentheses are the number of trials used in the statistics. Successful GO vs failed GO, ***P = 5.02 × 10⁻⁴; successful GO vs open-loop, ***P = 8.93 × 10⁻⁶, F(4, 53) = 23.86. One-way ANOVA, Bonferroni’s multiple comparison test. j Relationship between the correlation coefficient and distance among the 10 most-contributing neurons in the putatively SFPE-encoding ensemble. The data were averaged from 9 fish with this ensemble. Black line denotes the averaged correlation from 9 fish. Red line denotes the average of averaged 10 shuffled data from 9 fish (see “Methods”).