
|
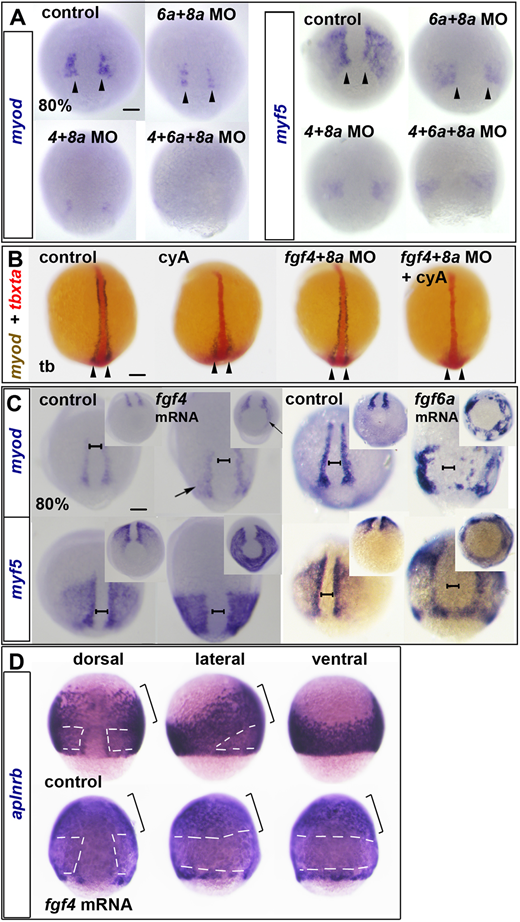
Fig. 3 (A-D) ISH for myod and myf5 (A,C) or aplnrb (D) mRNAs at 80% epiboly or tbxta (red) and myod (blue/brown) at the tailbud stage (tb) (B). (A) Reduction of myod and myf5 mRNAs in dual and triple Fgf MO-injected wild-type embryos. Arrowheads indicate nascent adaxial cells. (B) In contrast to 80% epiboly (compare with Fig. S4C), at the tailbud stage, cyA treatment ablates anterior adaxial myod mRNA, but leaves pre-adaxial expression intact (arrowheads). Injection of fgf4+fgf8a MOs ablate residual myod mRNA. (C) fgf4 or fgf6a mRNA injection upregulates myod and myf5 mRNAs around the marginal zone (arrows). Note the widening of the unlabelled dorsal midline region (brackets). Insets show the same embryos viewed from the vegetal pole. (D) fgf4 mRNA injection downregulates aplnrb mRNA around the marginal zone (white dashes) but not anteriorly (brackets) in the dorsalised embryo. Scale bars: 100 µm.