IMAGE

FIGURE 5

ID
ZDB-IMAGE-210909-10
Source
Figures for Jimenez et al., 2021
Image
Figure Caption

FIGURE 5

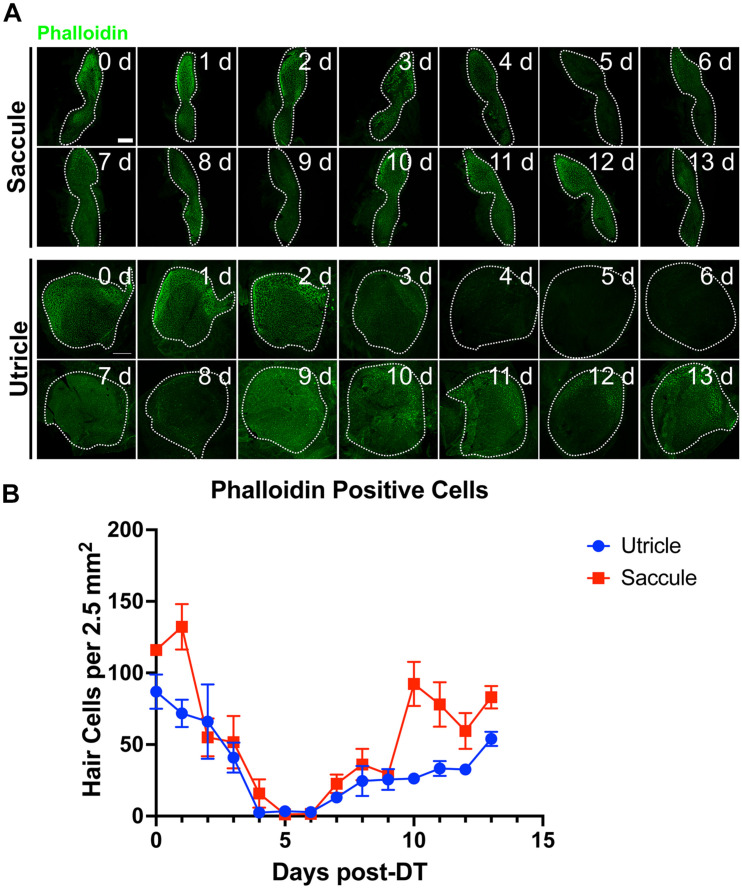
Tg(myo6b:hDTR) adult zebrafish hair cell loss and regeneration in the inner ear after DT treatment. (A) Tg(myo6b:hDTR) saccule and utricle used for quantification were isolated at specified timepoints following DT administration and hair cells were labeled with phalloidin (green channel). Scale bar 100 μm. (B) Quantification of phalloidin positive hair cell number after DT injection. Error bars demonstrate the mean ± SEM.

Acknowledgments
This image is the copyrighted work of the attributed author or publisher, and ZFIN has permission only to display this image to its users. Additional permissions should be obtained from the applicable author or publisher of the image. Full text @ Front. Cell. Neurosci.