
Image
|
Figure Caption
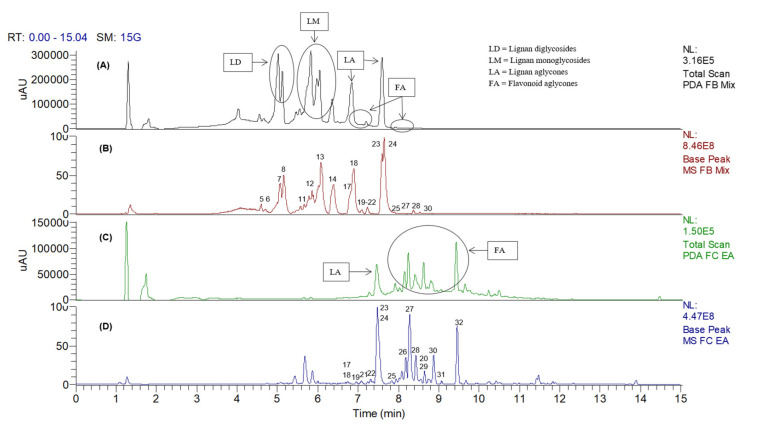
Figure 3 The LC–DAD and LC–MS base peak chromatogram profiles of the 50% MeOH (A,B) and EA (C,D) fractions of Clitorea ternatea roots, in negative ion mode.
Acknowledgments
This image is the copyrighted work of the attributed author or publisher, and
ZFIN has permission only to display this image to its users.
Additional permissions should be obtained from the applicable author or publisher of the image.
Full text @ Molecules