IMAGE

Fig. 4

ID
ZDB-IMAGE-210503-29
Source
Figures for Peruzzo et al., 2021
Image
Figure Caption

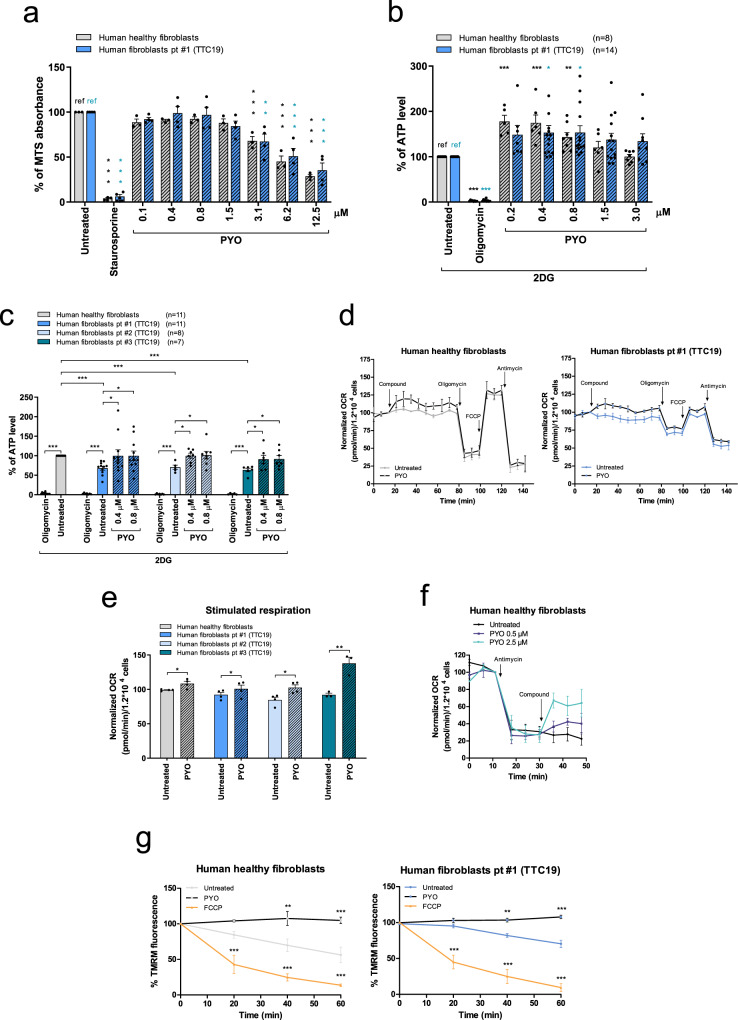
Fig. 4 PYO increases respiration and ATP production, and recovers mitochondrial morphology in human fibroblasts from patients with <italic>TTC19</italic> gene mutations.

a MTS assays were performed on human healthy fibroblasts (n = 3 independent assays) and fibroblasts from a patient harboring a homozygous pathogenic mutation in the TTC19 gene (fibroblasts pt#1) (n = 4 independent assays). Cells were either left untreated or treated with different dosages of PYO for 24 h to determine the highest concentration of PYO that did not affect cell survival. Positive control: 4 μM staurosporine. Data are percentages (means ± SEM) of MTS absorbance at 490 nm vs untreated sample (ref.). b, c Mitochondrial ATP content in human healthy fibroblasts and patients’ fibroblasts after treatment with PYO. Oligomycin was used as a control. Cells were treated for 1 h in a fresh medium, in which glucose had been replaced with 5.5 mM 2-DG to inhibit glycolysis. In b, values are reported as the percentage of luciferase signal vs. untreated sample (ref). In c, values are percentage of luciferase signal with reference to the untreated human healthy fibroblasts (in gray). Values are means ± SEM of independent experiments. d, e OCR was measured in human healthy fibroblasts and patient #1 fibroblasts (d) in the presence or absence of 0.8 μM PYO. Values were normalized to basal respiration before PYO (means ± SEM, n = 4 independent experiments). Bioenergetic parameters were calculated after sequential addition of oligomycin (2 μg/ml); FCCP (600 nM); antimycin A (1 μM). Stimulated respiration is reported in (e). Values are means ± SEM against untreated sample (n = 4 independent experiments). f OCR was measured in human healthy fibroblasts to assess the capability of PYO to restore cell respiration after antimycin A inhibition of CIII. Values were normalized vs. basal respiration recorded before antimycin A (means ± SEM, n = 3 independent experiments). g Mitochondrial membrane potential of human healthy fibroblasts and patient #1 fibroblasts was assessed monitoring the intensity of TMRM fluorescence after 0.8 μM PYO addition as in Fig. 2h (means ± SEM, n = 4 independent experiments). Two-way ANOVA with Bonferroni post test, or one-way ANOVA with Dunnett’s multiple comparison test, or two-tailed Student’s t test were determined (*p < 0.05; **p < 0.01; ***p < 0.001).

Acknowledgments
This image is the copyrighted work of the attributed author or publisher, and ZFIN has permission only to display this image to its users. Additional permissions should be obtained from the applicable author or publisher of the image. Full text @ Nat. Commun.