
IMAGE
Fig. 2
Image
|
Figure Caption
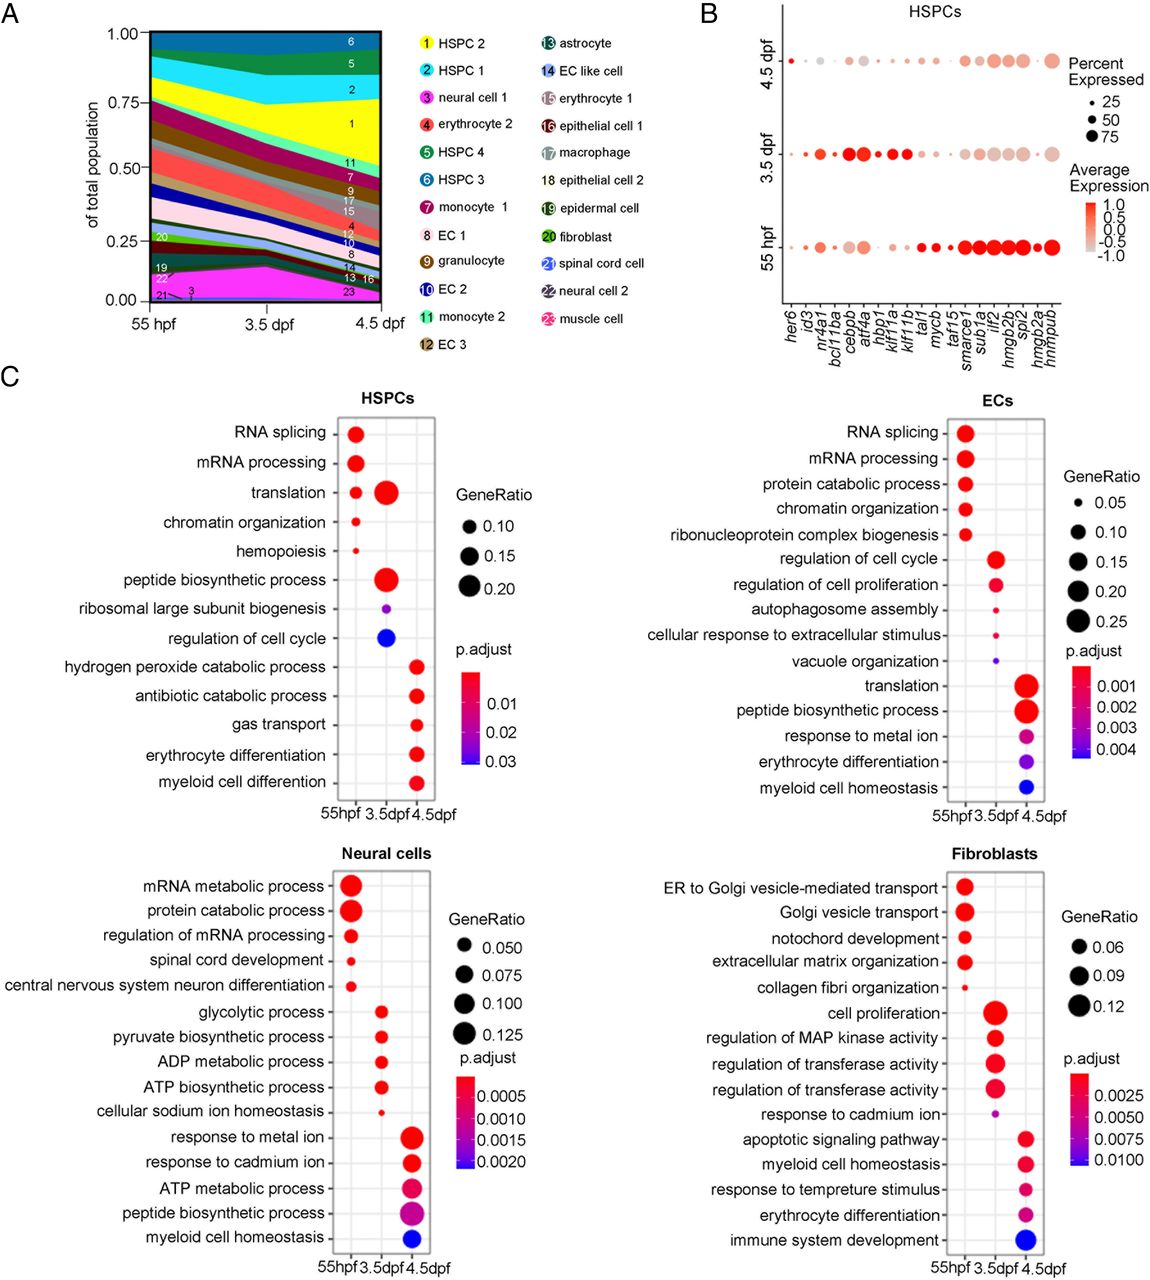
Fig. 2 Cell composition and gene-expression dynamics during CHT development. (A) Fraction of cell clusters per developmental stage, displaying a dynamic change in cell-type complexity throughout our sampling. (B) Dot plot showing the differentially expressed TFs within the HSPCs at each development stage. (C) Dot plots showing the differentially enriched GO terms within HSPCs, ECs, neural cells, and fibroblasts at each developmental stage.
Figure Data
Acknowledgments
This image is the copyrighted work of the attributed author or publisher, and
ZFIN has permission only to display this image to its users.
Additional permissions should be obtained from the applicable author or publisher of the image.
Full text @ Proc. Natl. Acad. Sci. USA