IMAGE

Figure 5

ID
ZDB-IMAGE-210413-13
Source
Figures for Hills et al., 2021
Image
Figure Caption

Figure 5

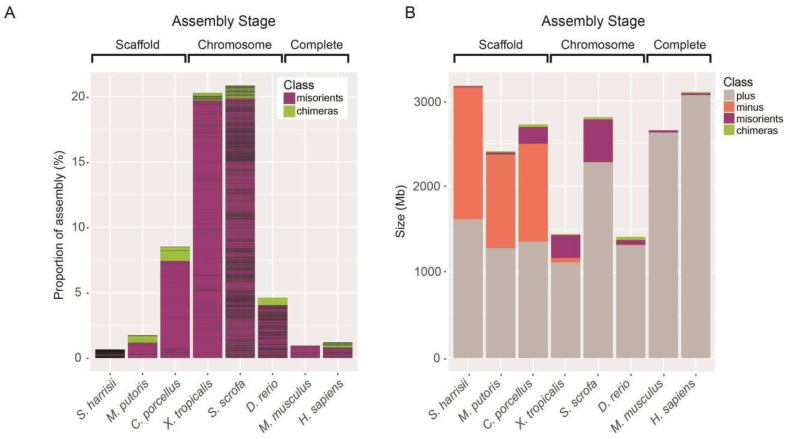
Assembly misorientations and chimeras are prevalent in early-stage genomes. (A) Percentage of assembly fragments classified as misorients or chimeras. Horizontal lines represent the sizes of each error within the assembly. Note that all chromosome-level assemblies displayed multiple orientation errors. The chimeric fragment within zebrafish is derived from an inverted region in the AB strain with respect to the Tübingen assembly [31], while misorients in the mouse were identified previously [4], and chimeras and misorients identified in the human sample correlated with previously identified heterozygous and homozygous inversions respectively [16]. (B) Barplot of scaffold orientation within each assembly. The predominant orientation of scaffolds within the assembly is set as correct (“+strand”, grey), and the frequency of scaffolds that do not match this orientation is calculated. Misorients are subdivided into entire scaffolds that are in the opposite orientation to the majority of assembly scaffolds (dark green), and fragments within contiguous sequence that are in the incorrect orientation (purple). Chimeric fragments (green) are defined as portions of contiguous sequence that display a different template strand inheritance pattern and are therefore likely placed to an incorrect chromosome. The proportion of incorrectly oriented scaffolds constitute half of the scaffold-level assemblies. Chromosome- and complete-level assemblies have fewer scaffolds (higher N50 values), so most assembly errors occur within contiguous sequences.

Acknowledgments
This image is the copyrighted work of the attributed author or publisher, and ZFIN has permission only to display this image to its users. Additional permissions should be obtained from the applicable author or publisher of the image. Full text @ Int. J. Mol. Sci.