
|
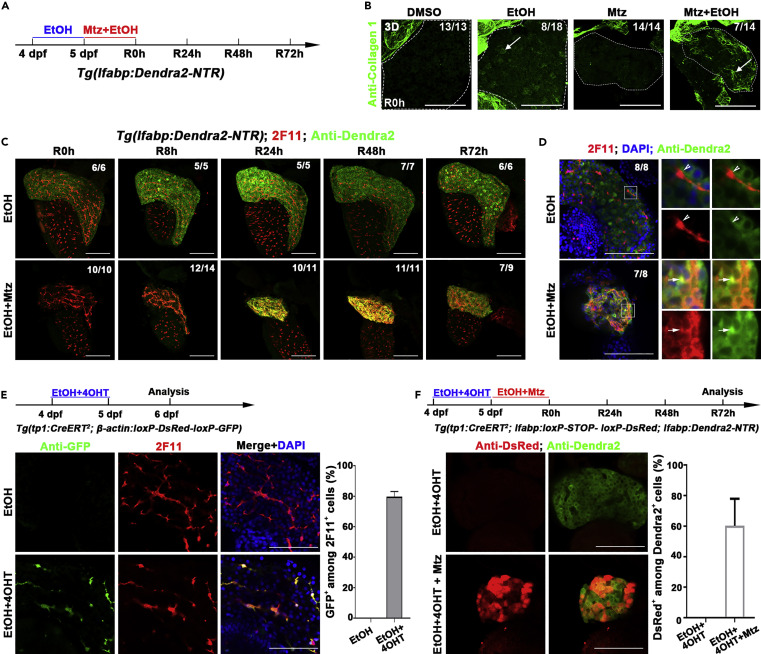
Fig. 4 BECs act as the major contributor to hepatocyte regeneration after extreme injury to fibrotic liver (A) Experimental scheme illustrating the stage of EtOH and Mtz treatment in transgenic line Tg(lfabp:Dendra2-NTR). (B) Confocal projection images (3D imaging) showing the staining of extracellular matrix protein collagen 1 in the liver region (dashed lines) after DMSO, EtOH, Mtz, and Mtz plus EtOH treatment at R0h (arrows). (C) Confocal projection images (3D imaging) showing the co-immunostaining for Dendra2 and 2F11 in regenerating livers after EtOH and Mtz treatment from R0h to R72h. (D) Single optical images showing the co-immunostaining for Dnedra2 and DsRed in regenerating livers at R24h. Most of the Dendra2+ cells are 2F11 positive in Mtz and EtOH treatment (arrows). In EtOH treatment, the 2F11+ and Dendra2+ cells are not co-stained (arrowhead). Nuclei were stained with DAPI (blue). (E) Experimental scheme illustrating the stage of 4OHT and EtOH treatment to double transgenic line, Tg(tp1:CreERT2; β-actin:loxP-DsRed-loxP-GFP), from 4 dpf to 5 dpf and analysis at 6 dpf. Immunostaining for 2F11 and GFP on livers (2D imaging) showing tp1-CreER labels the 2F11-positive cholangiocytes specifically after 4OHT and EtOH treatment. Nuclei were stained with DAPI (blue). Quantification of the percentages of GFP+ among 2F11+ hepatocytes (EtOH, n=5; EtOH+4OHT, n=8). (F) Experimental scheme illustrating the stage of 4OHT, EtOH, and Mtz treatment to triple transgenic line Tg(tp1:CreERT2; lfabp:loxP-STOP-loxP-DsRed; lfabp:Dendra2-NTR) and analysis at R72h. Single optical images showing the co-immunostaining for DsRed and Dendra2 at R72h after 4OHT, EtOH, and Mtz treatment. Quantification of the percentage of the DsRed+ among the Dendra2+ cells in regenerating livers at R72h (EtOH+4OHT, n=10; EtOH+4OHT+Mtz, n=10). Numbers indicate the proportion of larvae exhibiting the expression shown. Scale bars: 100 μm. Data are represented as mean ±SEM. See also Figures S4 and S5.