
Fig. 2
- ID
- ZDB-IMAGE-210407-12
- Genes
- Publication
- Lambert et al., 2020 - PDE10A inhibition reduces the manifestation of pathology in DMD zebrafish and represses the genetic modifier PITPNA
- All Figures
- Figures for Lambert et al., 2020
|
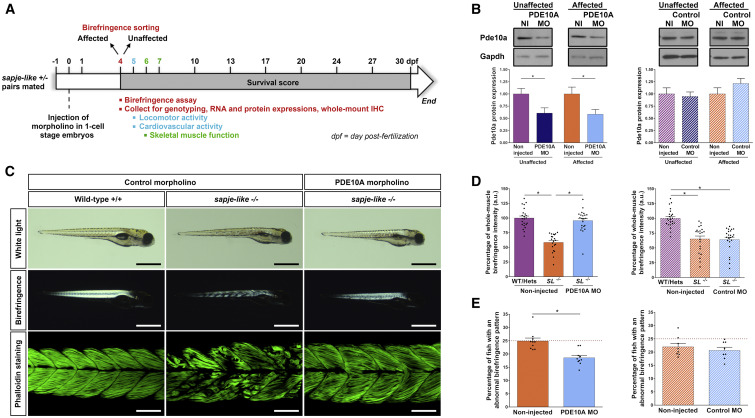
Fig. 2 pde10A Morpholino Reduces the Manifestation of the Dystrophic Muscle Birefringence Phenotype in Dystrophin-Deficient Zebrafish (A) Design of morpholino study: pairs of sapje-like+/− zebrafish were mated and pde10A morpholino or standard control morpholino (negative control) was injected in one-cell-stage progeny embryos. At 4 dpf, a birefringence assay was performed and unaffected (normal muscle birefringence phenotype) as well as affected larvae (abnormal muscle birefringence phenotype) were sorted to conduct genotyping or further analysis. In each experiment, morphant zebrafish (morpholino-injected larvae [MO]) were compared to non-injected siblings (non-injected larvae [NI]). (B) At 4 dpf, total proteins were extracted from 20 (n = 20) zebrafish per biological replicate and western blotting was performed. Upper panel: representative western blot images from Pde10a and Gapdh antibodies. Lower panel: bar graph showing Pde10a protein expression normalized to Gapdh. At least four (N = 4) independent experiments were performed. Statistical differences between groups are presented as follows: ∗p < 0.05 (t test, ±SEM). (C) White light, birefringence, and phalloidin staining images of representative 4-dpf larvae. Scale bars of white light and birefringence panels represent 1 mm. Scale bars of phalloidin staining panel represent 100 μm. (D) Dot plots showing percentage of whole-muscle birefringence intensity of 4-dpf larvae in pde10a morpholino experiments and control morpholino experiments. The muscle birefringence intensity was normalized to the respective area of measure, and larvae were genotyped. SL−/−, dystrophin null sapje-like−/− larvae. Twenty-one to 23 (n = 21–23) zebrafish per group were analyzed in three (N = 3) independent experiments. Statistical differences between groups are presented as follows: ∗p < 0.05 (t test, ±SEM). (E) Dot plots showing percentage of 4-dpf larvae that display an abnormal muscle birefringence pattern (named as abnormal birefringence score) in pde10a morpholino experiments and control morpholino experiments. Mendelian genetics dictates 25% of the progeny to be dystrophin null and exhibit the muscle dystrophic phenotype seen by birefringence (red dashed line). Each dot represents the percentage of zebrafish that display an abnormal muscle birefringence pattern in a cohort (n = 200–300) of non-injected or morphant siblings. Eight to 10 (N = 8–10) independent experiments were performed per condition. Statistical differences between groups are presented as follows: ∗p < 0.05 (t test, ±SEM).