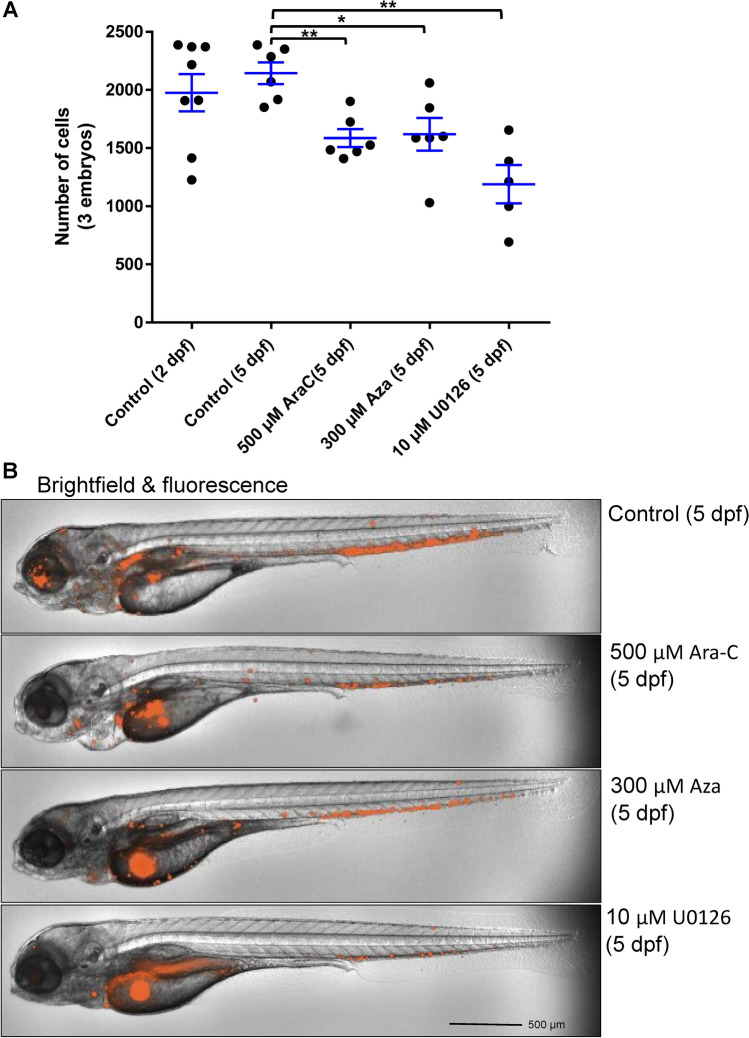
IMAGE

Figure 5

ID
ZDB-IMAGE-210319-89
Source
Figures for Somasagara et al., 2021
Image
Figure Caption

Figure 5

MV4-11 cells in zebrafish xenografts and drug treatment. Proliferation of MV4-11 cells in the zebrafish xenograft model with Ara-C and Aza treatments started from 2 dpf. The zebrafish xenograft embryos were dissociated (control group at 2 dpf and 5 dpf and treatment group at 5 dpf), and labeled leukemia cells were analyzed by ImageXpress Pico. (A) Total MV4-11 cells in zebrafish xenografts after Ara-C (500 µM), Aza (300 µM), and U0126 (10 µM) treatment. (B) Representative images of zebrafish xenografts with respective concentrations of drug treatment at 5 dpf. Quantitative values were means ± SEM from 5 to 8 independent groups of 3 xenografts in each group. Significance p values were determined as *p ≤ 0.05, **p ≤ 0.01 and ***p ≤ 0.001.

Acknowledgments
This image is the copyrighted work of the attributed author or publisher, and ZFIN has permission only to display this image to its users. Additional permissions should be obtained from the applicable author or publisher of the image. Full text @ Sci. Rep.