
|
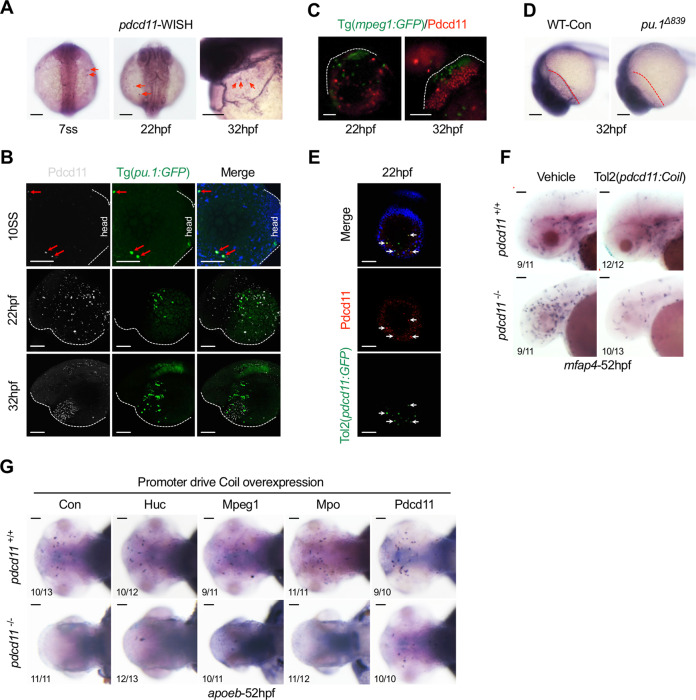
Fig. 6 a WISH assessment of pdcd11 expression in zebrafish at 7-ss, 22 hpf, and 32;hpf. The red arrows indicate pdcd11 signals on the YS and pericardial cavity. b Immunofluorescence staining of Pdcd11 in Tg(pu.1:GFP) zebrafish. The red arrows indicate colocalized Pdcd11 and Pu.1 expressing cells on the YS at 10-ss. c Pdcd11 expression in 22 hpf and 32 hpf Tg(mpeg1:GFP) zebrafish assayed by immunofluorescence staining. d WISH examination of pdcd11 expression in pu.1 deficient embryos. The red dotted lines denote the pericardial cavity underneath the brain where pdcd11 expressed. e IF assessment of the co-expression between GFP driven by pdcd11 promoter and endogenous Pdcd11. White arrowheads indicate the colocalization signal on the 22 hpf YS. f The expression pattern of mfap4-positive macrophages in the 52 hpf brain with pdcd11 promoter driven Coil overexpression. g Rescue effects of apoeb positive microglia with Coil overexpressed under different promoters including Huc, mpeg1, mpo, and pdcd11. The number positioned in the lower left corner of Fig. 6f, g represent the number of zebrafish embryos shown positive phenotypes versus the total number of embryos examined. Scale bar: 100 μm.