
Image
|
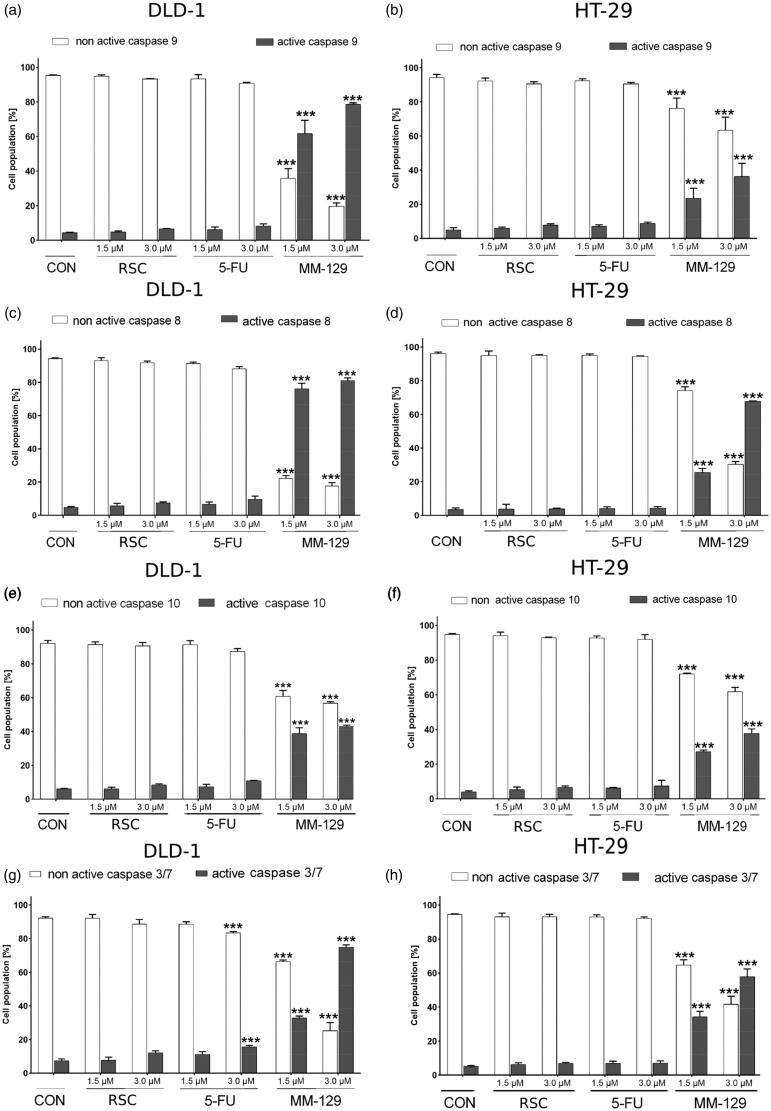
Figure Caption
Figure 8. Flow cytometric analysis of caspase-9, caspase-8, caspase-10, and caspases-3/7 activation in the populations of DLD-1 (a, c, e, g) and HT-29 (b, d, f, h) colon cancer cells treated for 24 h with roscovitine (RSC), 5-fluorouracil (5-FU), and MM-129 (1 μM and 3 μM). Mean percentage values from three independent experiments done in duplicate (N = 6) were presented as mean ± standard deviation (SD), and analysed using one-way analysis of variance (ANOVA). ***p<.001 vs. CON.
Acknowledgments
This image is the copyrighted work of the attributed author or publisher, and
ZFIN has permission only to display this image to its users.
Additional permissions should be obtained from the applicable author or publisher of the image.
Full text @ J Enzyme Inhib Med Chem