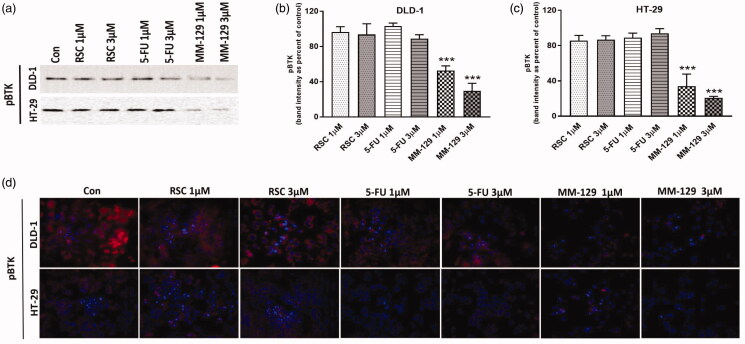
IMAGE

Figure 5.

ID
ZDB-IMAGE-210208-36
Source
Figures for Hermanowicz et al., 2021
Image
Figure Caption

Figure 5.

The down-regulation of Bruton’s kinase (BTK) expression by MM-129. Phosphorylated BTK (pBTK) expression was determined by Western blot (a) and confocal microscopy (d) in DLD-1 and HT-29 cells treated with MM-129, roscovitine and 5-flurouracil in two concentrations: 1 µM and 3 µM for 24 h. The band staining was quantified by densitometry (b, c). Samples used for electrophoresis consisted of 20 µg of protein from six pooled cell extracts (n = 6). Data were presented as mean ± standard deviation (SD), and analysed using one-way analysis of variance (ANOVA). ***p<.001 vs. CON intensity of cytoplasmic/nuclear fluorescence was analysed in cell populations. Images of cells labelled with FITC were obtained using a 515LP emission laser and a 488/10 excitation laser (d).

Acknowledgments
This image is the copyrighted work of the attributed author or publisher, and ZFIN has permission only to display this image to its users. Additional permissions should be obtained from the applicable author or publisher of the image. Full text @ J Enzyme Inhib Med Chem