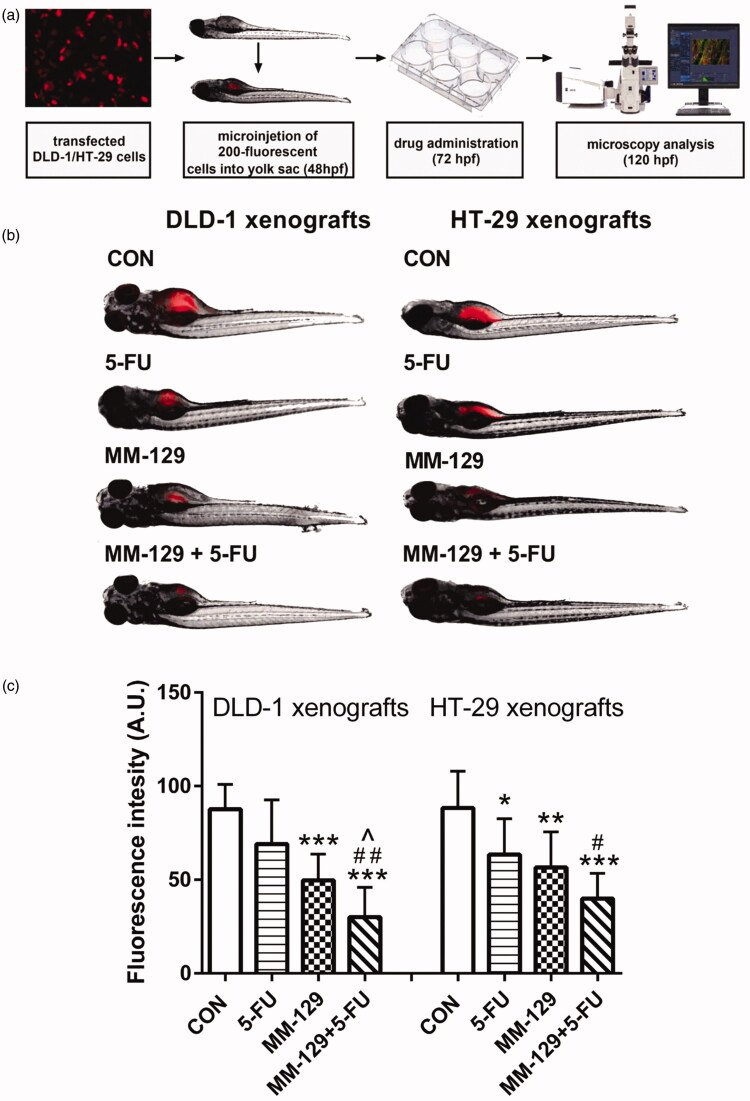
IMAGE

Figure 2.

ID
ZDB-IMAGE-210208-33
Source
Figures for Hermanowicz et al., 2021
Image
Figure Caption

Figure 2.

Schematic of xenograft assay and analysis of tumour development (a). Site-specific injection (yolk sac) of transfected (red) colon cancer cells (DLD-1 and HT-29) into 48 hpf zebrafish embryos and imaging analysis of tumour growth after 48 h of incubation with MM-129 (50 µM), 5-FU (50 µM), or a combination of these agents (b). Quantification of total fluorescence by colon cancer cells three days after injection (c) n = 8, *p < .05, **p < .01, ***<.001 vs. CON; ^p < .05 vs. MM-129, #p < .05, ##p < .01 vs. 5-FU. Data were presented as mean ± standard deviation (SD), and analysed using one-way analysis of variance (ANOVA). p < .05 was considered statistically significant.

Acknowledgments
This image is the copyrighted work of the attributed author or publisher, and ZFIN has permission only to display this image to its users. Additional permissions should be obtained from the applicable author or publisher of the image. Full text @ J Enzyme Inhib Med Chem