
|
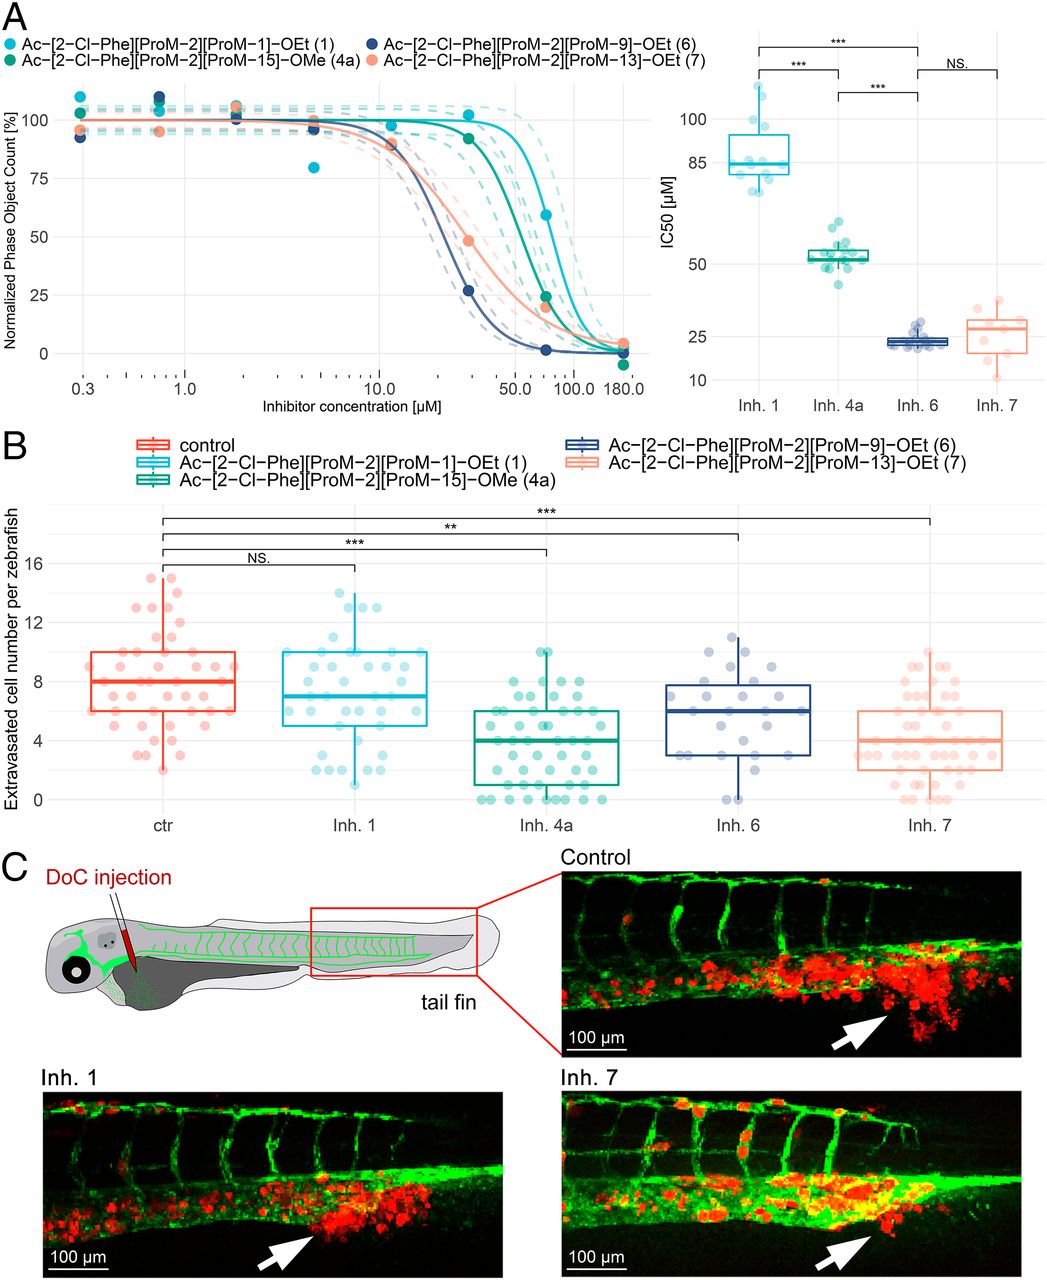
Fig. 6 Cellular and in vivo studies with the initial and optimized inhibitors. (A) IncuCyte chemotaxis assay with inhibitor-treated MDA–MB–231. (Left) Invasion is inhibited in a dose-dependent manner (representative phase object count, normalized to fitted IC50 curves with 3σ dashed line). (Right) IC50s were calculated during linear phase object signal increase of the assay and are plotted as a group. (B) MDA–MB–231 cancer cells extravasation in zebrafish treated with PBS (control) or inhibitors 1, 4a, 6, or 7 at 1 μM concentration. (C) Representative fluorescence images of zebrafish embryos taken on day 5. MDA–MB–231 (red) extravasate into the avascular tailfin (white arrows).