IMAGE

Fig 8

ID
ZDB-IMAGE-210128-36
Genes
Source
Figures for Petratou et al., 2021
Image
Figure Caption

Fig 8 Mitfa represses <italic>tfec</italic> expression in melanoblasts.

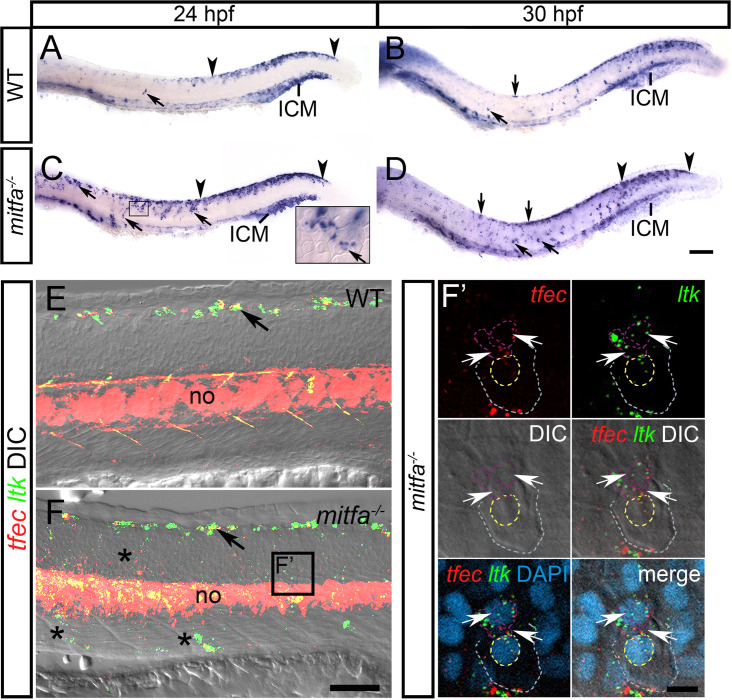
In WT embryos at 24 hpf (A) and at 30 hpf (B), tfec expression is detectable in Ib(sp) and Ib(df) (arrows), respectively, and in the posteriorly regressing early NCC/Cbl domain of the dorsal posterior trunk and tail (region within arrowheads), but expression is undetectable in the lateral migration pathway. At 24 hpf (C) and at 30 hpf (D), mitfa mutants present with an increased number of tfec-positive cells (arrows) along the dorsal trunk, as well as in the medial and lateral (C, inset) migratory pathways. RNAscope (E,F) performed on mitfa mutants at 30 hpf shows an increased number of tfec-positive cells compared to the WT on the migration pathways (F, asterisks). Arrows indicate iridoblast precursors along the dorsal trunk. (F’) RNAscope reveals that in mitfa mutants ectopic tfec-positive cells migrating on the lateral migration pathway (below the epidermis; grey and yellow dashed lines indicate the periphery and nuclear boundary, respectively, of overlying keratinocytes) co-express ltk (arrows; nuclei indicated by purple dashed lines), and thus likely correspond to Ib(sp). ICM, intermediate cell mass; LP, lateral patches; no, notochord. Lateral views, head towards the left. Scale bars: A-D: 100 μm; E,F: 50 μm; F’: 10 μm.

Figure Data
Acknowledgments
This image is the copyrighted work of the attributed author or publisher, and ZFIN has permission only to display this image to its users. Additional permissions should be obtained from the applicable author or publisher of the image. Full text @ PLoS One