
|
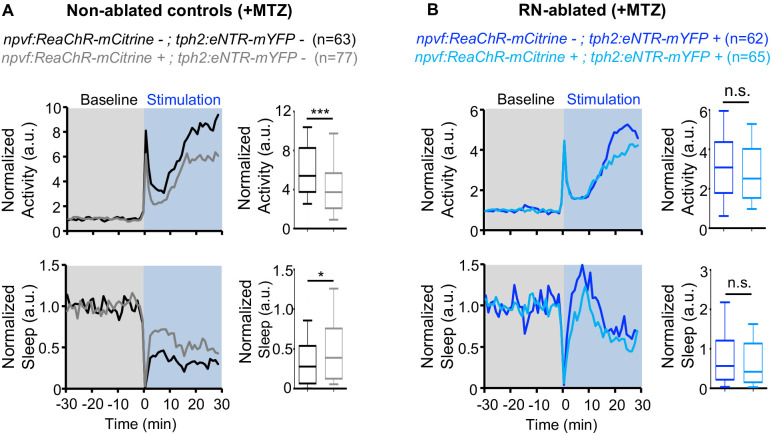
Figure 5—figure supplement 1. Normalized locomotor activity (top) and sleep (bottom) of 5-dpf Tg(npvf:ReaChR-mCitrine) (gray and light blue) and non-transgenic sibling control (black and blue) animals before (Baseline) and during blue light exposure (Stimulation) in Tg(tph2:eNTR-mYFP) negative (A) or positive (B) siblings. Because the animals see the blue light, they exhibit a brief startle at light onset that is excluded from analysis, followed by a gradual increase in activity that plateaus after ~15 min. Box plots quantify locomotor activity and sleep for each animal during optogenetic stimulation normalized to the baseline of all animals of the same genotype. n = number of animals. ns p>0.05, *p<0.05, ***p<0.005, Mann-Whitney test.