
Image
|
Figure Caption
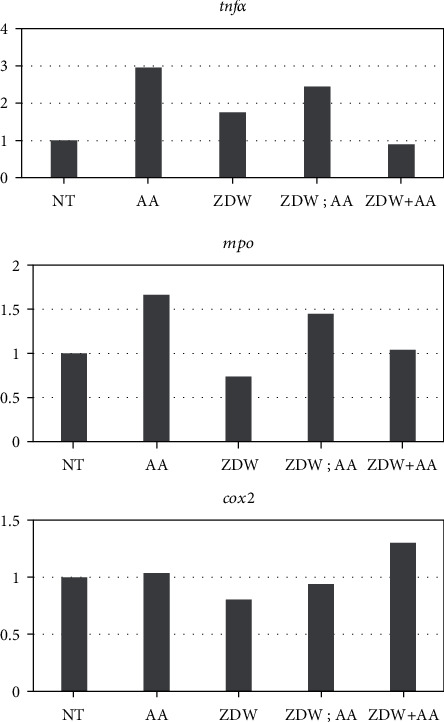
Figure 6
Quantitative gene expression was analyzed by quantitative reverse transcription-polymerase chain reaction (qRT-PCR). The total RNA was extracted at the 48 hpf, and the relative expression levels of the indicated genes were determined by qRT-PCR. The gene expression results of the indicated genes between no treatment control (NT) and different experimental groups. The data in triplicate were normalized for zebrafish
Acknowledgments
This image is the copyrighted work of the attributed author or publisher, and
ZFIN has permission only to display this image to its users.
Additional permissions should be obtained from the applicable author or publisher of the image.
Full text @ Biomed Res. Int.