
Image
|
Figure Caption
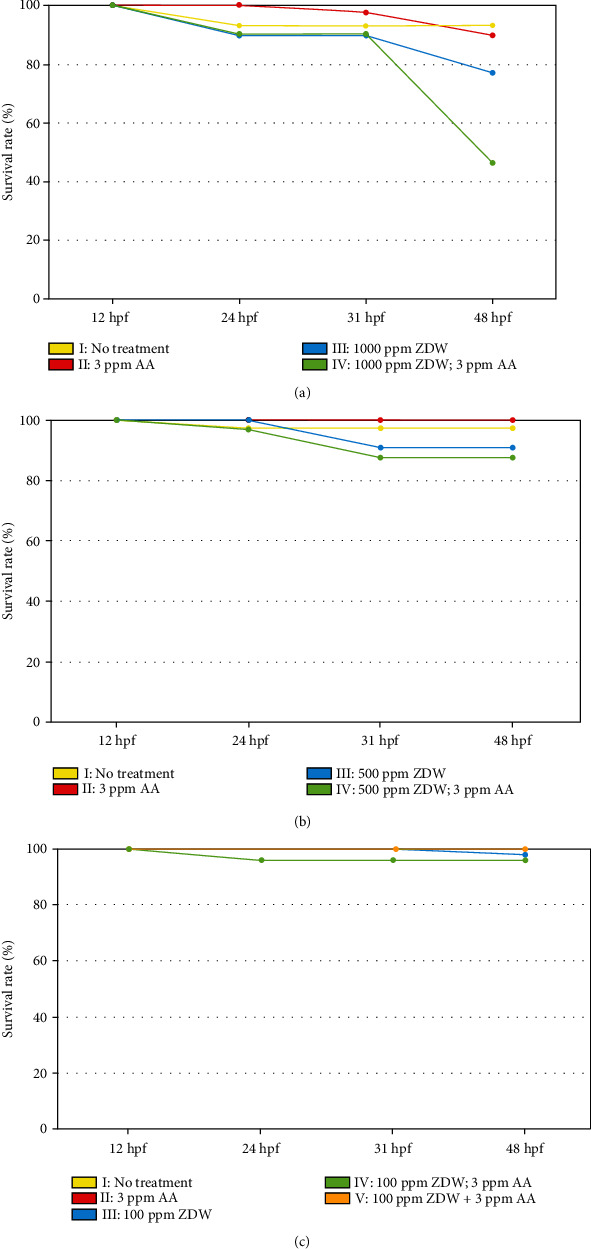
Figure 2
ZDW dose titration and survival rate analysis in this study. For ZDW dose titration, wild-type (WT; AB strain) embryos were collected, randomly divided into 50 per experimental group, and exposed to either water (no treatment, control: 0 ppm) or water containing ZDW (1000, 500, and 100 ppm, (a)–(c)) and/or 3 ppm AA. All embryos were cultivated in 6-well cell culture plates, and survival rates were determined at 12, 24, 31, and 48 hpf. The
Acknowledgments
This image is the copyrighted work of the attributed author or publisher, and
ZFIN has permission only to display this image to its users.
Additional permissions should be obtained from the applicable author or publisher of the image.
Full text @ Biomed Res. Int.