IMAGE

Figure 1

ID
ZDB-IMAGE-201213-1
Antibodies
Source
Figures for Oel et al., 2020
Image
Figure Caption

Figure 1

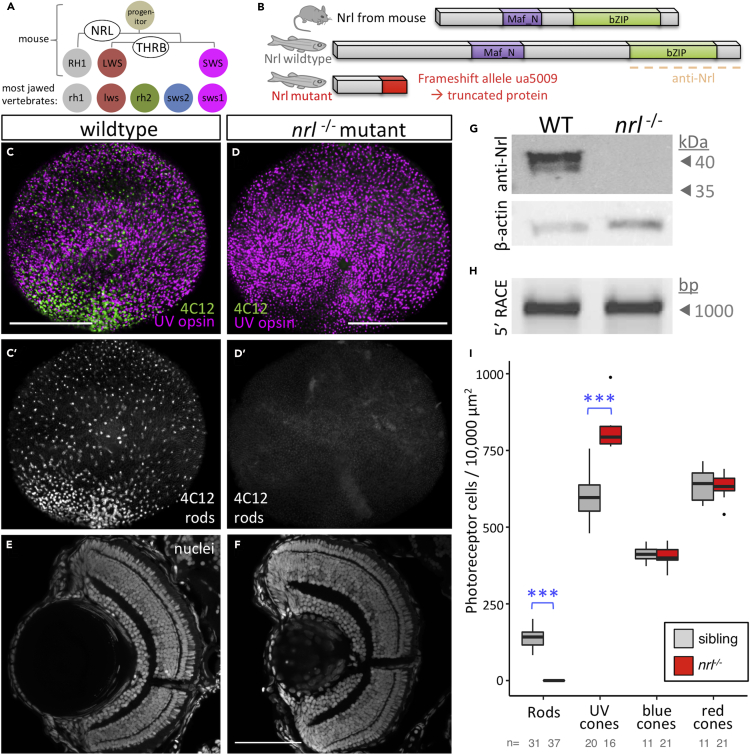
Nrl Is Conserved and Required for Rod Specification in Larval Zebrafish

(A) Nrl is the master regulator of photoreceptor specification in mice, being both necessary and sufficient for rod photoreceptor development from progenitor cells. Elegantly simple models can account for cell fate specification and generating the full complement of photoreceptor types in mice (and all mammals studied) using only two factors, NRL and THRB (thyroid hormone receptor β), to generate rods, red cones, and blue cones expressing RH1, LWS, and SWS opsins, respectively. However, most vertebrates possess additional cone subtypes.

(B) Zebrafish Nrl protein is recognizably similar to mammalian homologs. An nrl−/− null mutation was engineered via CRISPR that is predicted to truncate the protein (see also Figure S1).

(C and D) CRISPR-engineered null Nrl mutants lack rods in larval zebrafish, matching the phenotype of adult NRL−/− knockout mice. Flat-mounted retina from larval zebrafish show that rods are absent in nrl−/− larvae, as detected by rod immunomarker 4C12. The typical broad distribution of rods (B′) is absent (C′) and the decrease in rod cell abundance is consistent, nearly complete and robustly significant (I).

(E and F) Retina of nrl−/− larvae is broadly normal in its lamination.

(G) Nrl protein is not detectable in nrl−/− retina, and antibody validation is supported by a doublet band (presumably reflecting SUMOylation as per mammalian homologs of Nrl) appearing at the predicted size of 44.2 kDa (See Figure S1 for full immunoblots and quantification).

(H) Assessment of nrl transcript by 5′RACE (random amplification of cDNA ends) does not reveal any unexpected transcripts such as those with cryptic exons that could be imagined to make functional protein.

(I) Quantification of photoreceptor types in nrl−/− larvae confirms the consistent absence of rod cells and a concomitant increase in UV cone abundance. Box and whisker plots first through third quartile and distribution of data, respectively, after excluding outliers. ∗∗∗p < 0.001; bar in D is 100 um. The number of individual larvae examined (n) is indicated.

Figure Data
Acknowledgments
This image is the copyrighted work of the attributed author or publisher, and ZFIN has permission only to display this image to its users. Additional permissions should be obtained from the applicable author or publisher of the image. Full text @ iScience