
Image
|
Figure Caption
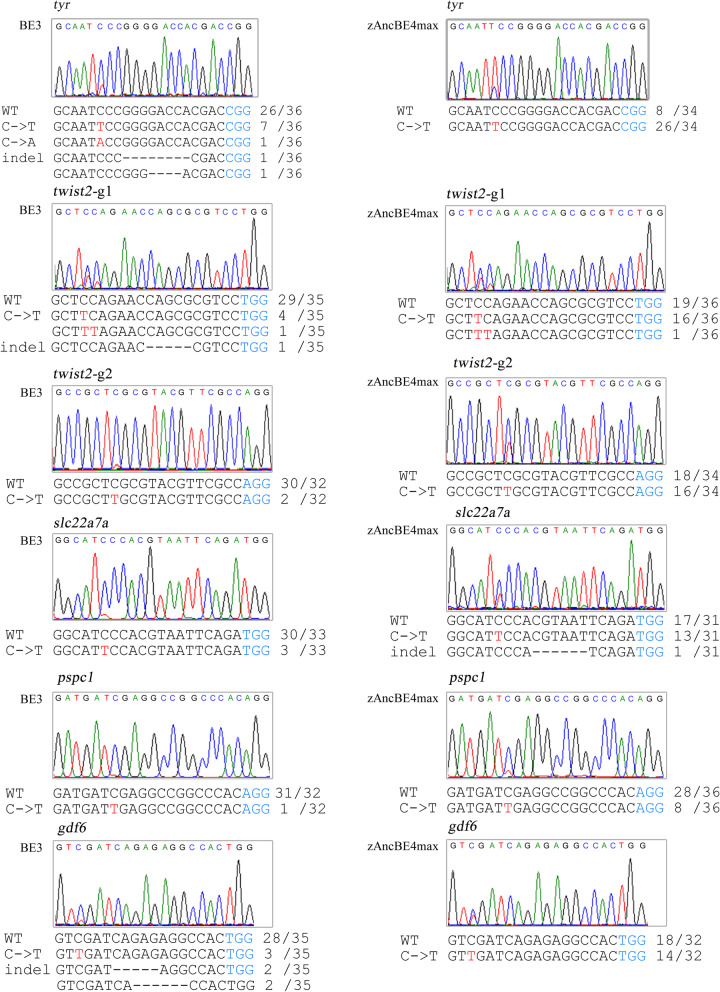
Fig. 2
Base C-to-T editing efficiency using zAncBE4max in zebrafish. The zAncBE4max system (right panel) showed higher activity of C-to-T editing than the BE3 system (left panel) at 6 tested sites. Red letter C indicates sites of C-to-T conversion and corresponding overlapped peaks in sequencing chromatogram. PAM region is indicated in blue. Mutant number in sequenced clones is shown on the right of sequences
Acknowledgments
This image is the copyrighted work of the attributed author or publisher, and
ZFIN has permission only to display this image to its users.
Additional permissions should be obtained from the applicable author or publisher of the image.
Full text @ BMC Biol.