
Figure 4
- ID
- ZDB-IMAGE-201107-17
- Genes
- Antibodies
- Publication
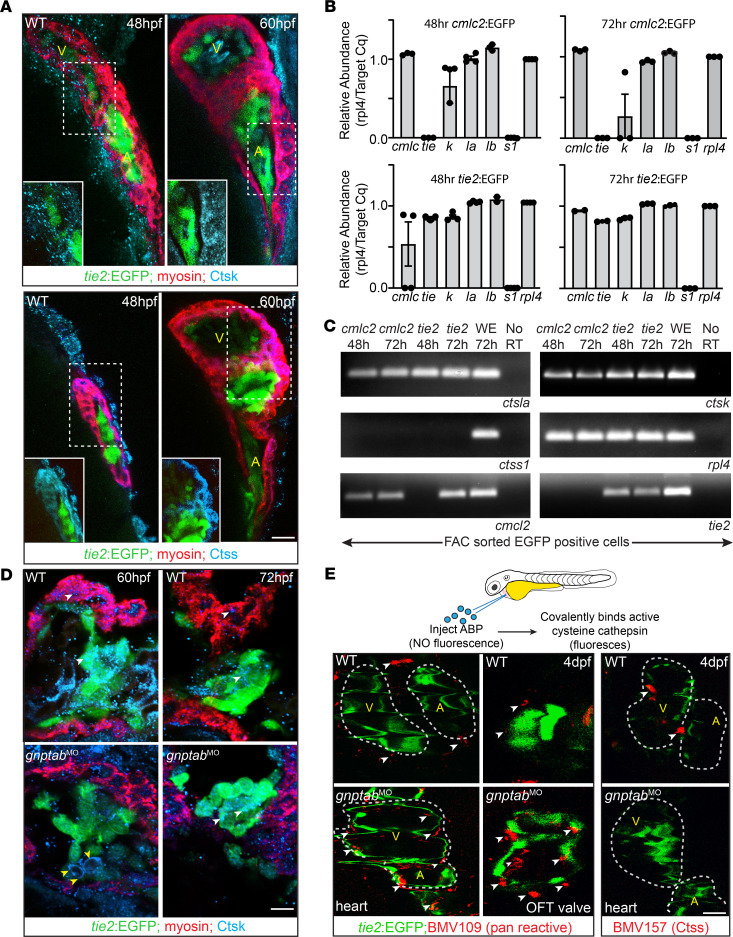
- Lu et al., 2020 - Inappropriate cathepsin K secretion promotes its enzymatic activation driving heart and valve malformation
- All Figures
- Figures for Lu et al., 2020
|
Figure 4
(