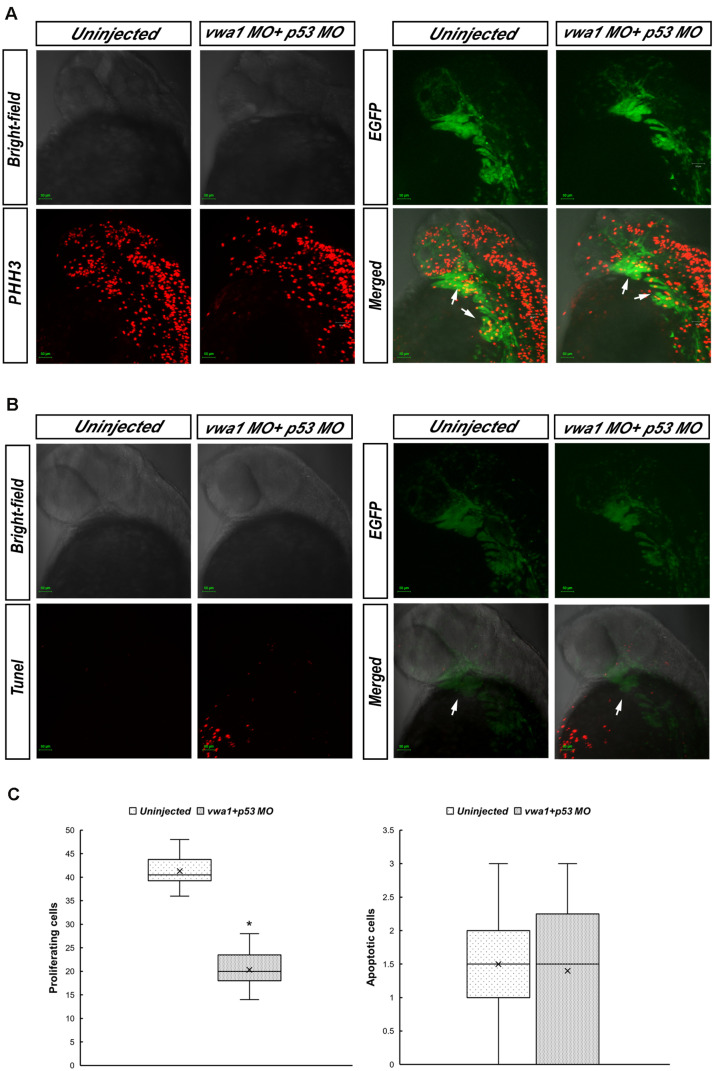
IMAGE

FIGURE 6

ID
ZDB-IMAGE-201007-19
Genes
Source
Figures for Wang et al., 2020
Image
Figure Caption

FIGURE 6

Proliferation and apoptosis of cranial neural crest cells at approximately 30 hpf. (A) Immunofluorescence results showing anti-phosphohistone H3 (PHH3) staining demonstrating cell proliferation. Merged image demonstrates higher anti-PHH3 signals in cranial neural crest cells compared with uninjected embryos. Arrows: pharyngeal arches. (B) Apoptosis assessed by immunofluorescence detection of TUNEL assay. The apoptosis signal in the vwa1 + p53 MO group did not coincide with EGFP fluorescence. Arrows: pharyngeal arches. (C) Comparison of apoptotic and proliferative numbers of neural crest cells in pharyngeal arches between vwa1 + p53 MO-injected embryos and uninjected control embryos. The difference in cell proliferation was statistically significant (p < 0.05, Student’s t-test). Lower/upper whiskers: 1st and 4th quartiles of the data; box: 2nd and 3rd quartiles of the data; mid-line: median of the data; ×: mean value of the data; *: significantly different.

Figure Data
Acknowledgments
This image is the copyrighted work of the attributed author or publisher, and ZFIN has permission only to display this image to its users. Additional permissions should be obtained from the applicable author or publisher of the image. Full text @ Front Cell Dev Biol