Image
Figure Caption

Figure 2—figure supplement 3. Interrogation of a mouse single cell transcriptomic dataset to identify genes characterising mouse ENS neurons and ENS glia.

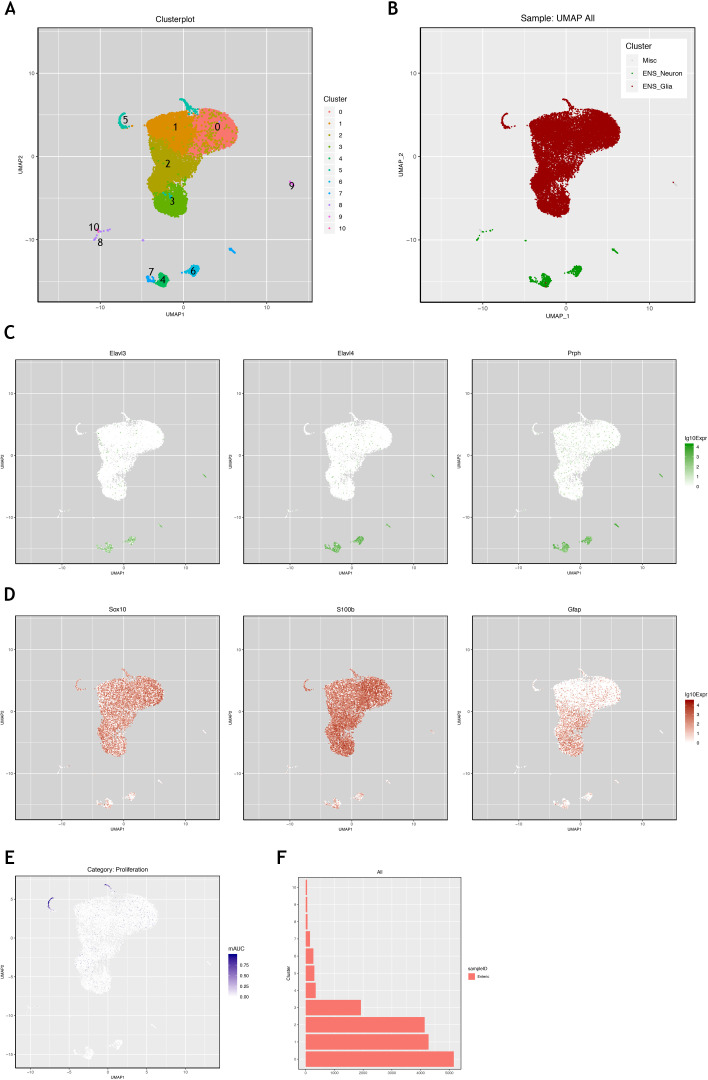
Using the mouse single cell transcriptomic data from Zeisel et al., 2018, which was downloaded from the Linnarsson lab website (https://storage.googleapis.com/linnarsson-lab-loom/l1_enteric.loom), the data were processed as described in the Methods methods section in order to determine differential gene expression between predominantly neuronal and glia clusters. Clusters shown in the UMAP (A) were labelled as neural or glial (B) based on expression of known neural expressed genes, Elavl3, Elavl4, Prph (C), or known glial expressed genes, Sox10, S100b and Gfap (D). (E) Examination of genes characteristic of proliferation (Top2A and Ki67 shown as examples here) indicates that cluster five is enriched for proliferative ENS glia. (F) Cluster five contains ~300 cells, representing 1.9% of the ~15,000 glial cells in this analysis of the dataset. This corresponds to the proliferative ENS glia cluster ENTG1 identified in the original Zeisel et al., 2018 publication, which comprised 1.6% of ENS glia.

Acknowledgments
This image is the copyrighted work of the attributed author or publisher, and ZFIN has permission only to display this image to its users. Additional permissions should be obtained from the applicable author or publisher of the image. Full text @ Elife