
Fig. 6
|
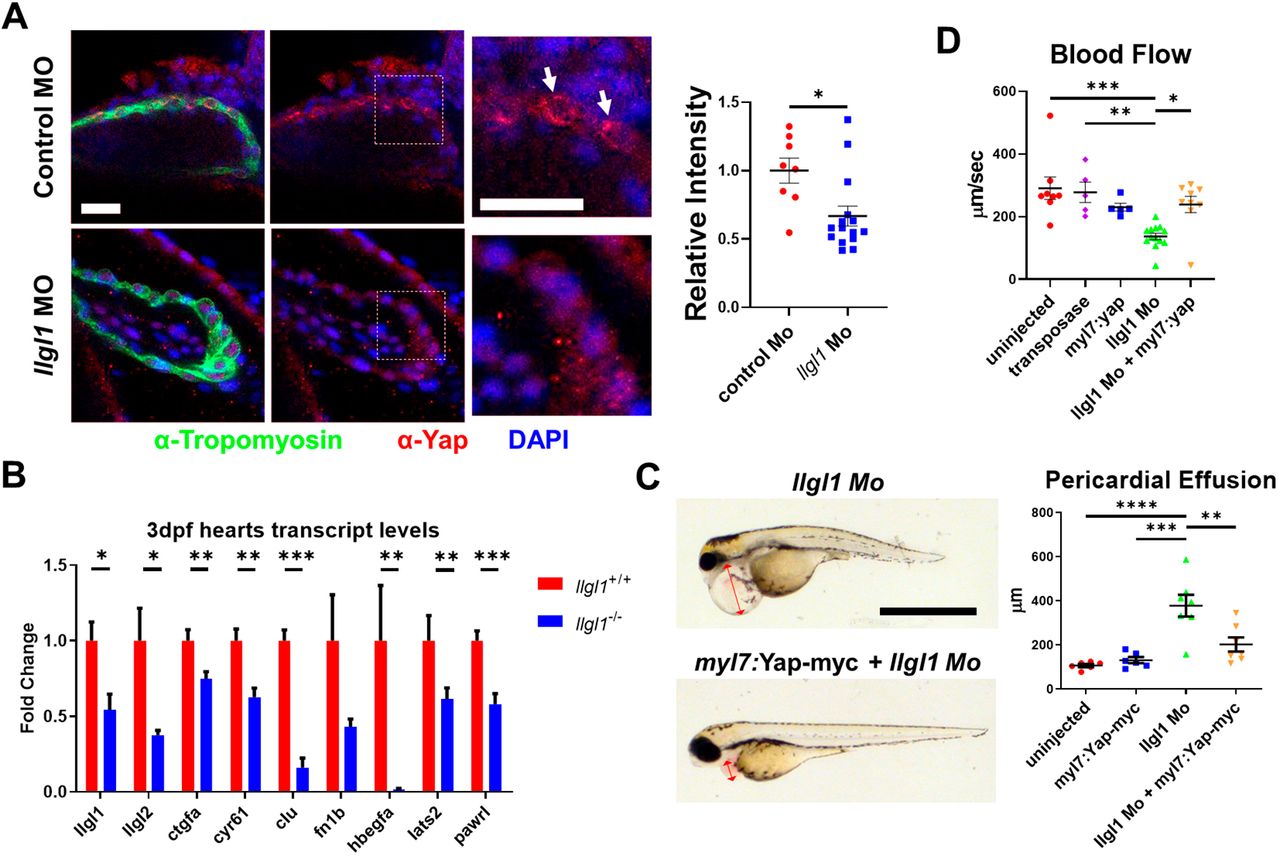
Fig. 6 Llgl1 promotes appropriate Yap protein levels in cardiomyocytes, and exogenous expression of Yap in cardiomyocytes ameliorates deleterious cardiac physiology associated with loss of Llgl1. (A) Representative images of 2 dpf zebrafish ventricles from single plane confocal micrographs (left). Boxes indicate area of enlargement. Arrows depict Yap within the cardiomyocytes. Quantification of the intensity of anti-Yap signature in tropomyosin+ cells normalized to the control morpholino group (right). n=8 for untreated embryos and n=15 for llgl1 morpholino-treated embryos. (B) qRT-PCR transcript analysis for llgl1, llgl2 and genes regulated by Yap activity in llgl1+/+ or llgl1−/− 3 dpf zebrafish hearts. n=10 for each group. (C) Representative images of 3 dpf embryos microinjected with llgl1 morpholino with or without Tol2-mediated integration of myl7:yap-myc (left). Arrows depict the region measured for pericardial effusion. Quantification of pericardial effusion in 3 dpf embryos (right). n=6 for uninjected control group, n=6 for the myl7:yap-myc control group, n=7 for llgl1 morphants and n=7 for llgl1 morphants with myl7:yap-myc expression. (D) Quantification of blood flow velocity in 2 dpf embryos. n=8 for the uninjected control group, n=5 for the transposase only control group, n=5 for the myl7:yap-myc control group, n=13 for llgl1 morphants and n=9 for llgl1 morphants with myl7:yap-myc expression. Two-tailed unpaired Student's t test (A,B) and One-way ANOVA, Tukey's multiple comparisons test (C,D). Error bars indicate s.e.m. *P<0.05, **P<0.01, ***P<0.001,****P<0.0001. Scale bars: 50 µm (A); 1 mm (C).