
|
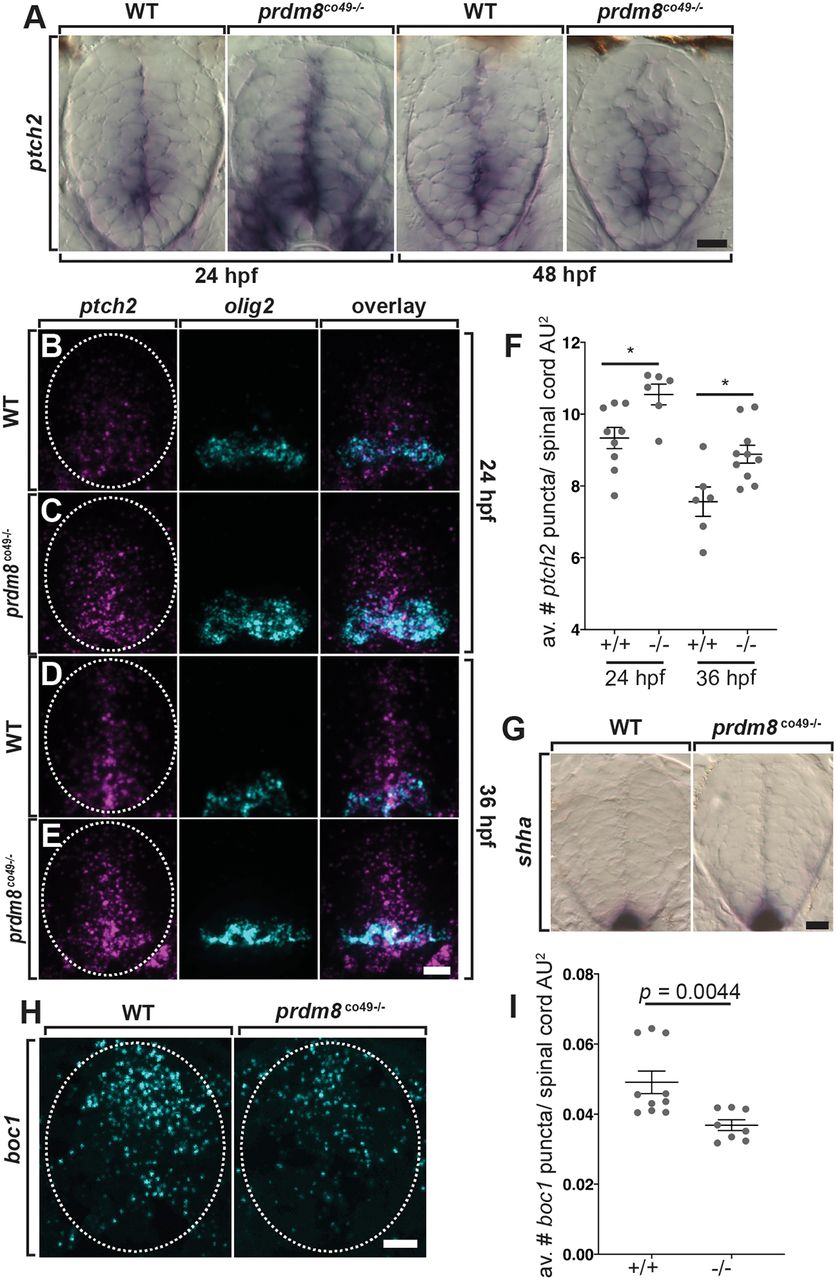
Fig. 9 Spinal cord cells of prdm8 mutant embryos have elevated Shh signaling activity. (A) Representative transverse sections of trunk spinal cords obtained from 24 and 48 hpf wild-type (WT) and prdm8co49−/− embryos (dorsal up) showing ptch2 RNA expression. (B-E) Representative transverse trunk spinal cord sections processed for fluorescent ISH to detect olig2 (blue) and ptch2 (pink) mRNA at 24 hpf (B,C) and 36 hpf (D,E). (F) prdm8co49−/− embryos have more ptch2 puncta per AU2 of spinal cord at 24 hpf (n=6) and 36 hpf (n=10) than wild-type embryos at 24 hpf (n=9) and 36 hpf (n=6). (G) Representative transverse sections of trunk spinal cord (dorsal up) showing shha RNA expression in 24 hpf wild-type and prdm8co49−/− embryos. (H) Representative transverse trunk spinal cord sections processed for fluorescent ISH to detect boc1 (blue) mRNA at 24 hpf. (I) Wild-type embryos (n=6) have more boc1 puncta per AU2 of spinal cord at 24 hpf than prdm8co49−/− embryos (n=8). Data are mean±s.e.m. with individual data points indicated. Statistical significance was evaluated by an unpaired, two-tailed Student's t-test (F) and by Mann-Whitney U test (I). *P<0.001. Dashed oval outlines the spinal cord boundary. Scale bars: 10 μm.